The Project Prioritization Tool is an Excel-based matrix tool designed to help teams compare projects using impact, complexity, and ROI to support decision-making and prioritize investments.
There are multiple situations where projects need to be prioritized according to various criteria such as impact, ease of implementation, short-term vs long-term considerations, and Return on Investment (ROI). The proposed Excel tool simplifies the comparison between projects or actions by providing visual capabilities to assess, discuss, and prioritize them.
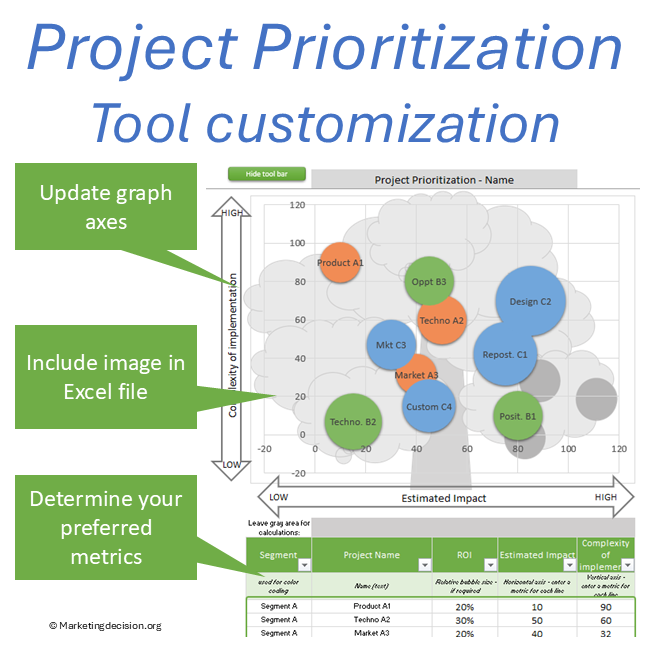
The tool allows projects to be compared using a matrix approach, where the horizontal axis represents impact, the vertical axis represents complexity of implementation, and bubble size represents ROI. This enables teams to visually identify and prioritize the most attractive initiatives.
Designed for professional use, this application is available as an Excel file and is provided in English for companies and professionals.
To view images, click the magnifying glass icon in the top right corner of the image, or browse through the image carousel below.
© marketingdecision.org
€22.00 Exc. VAT
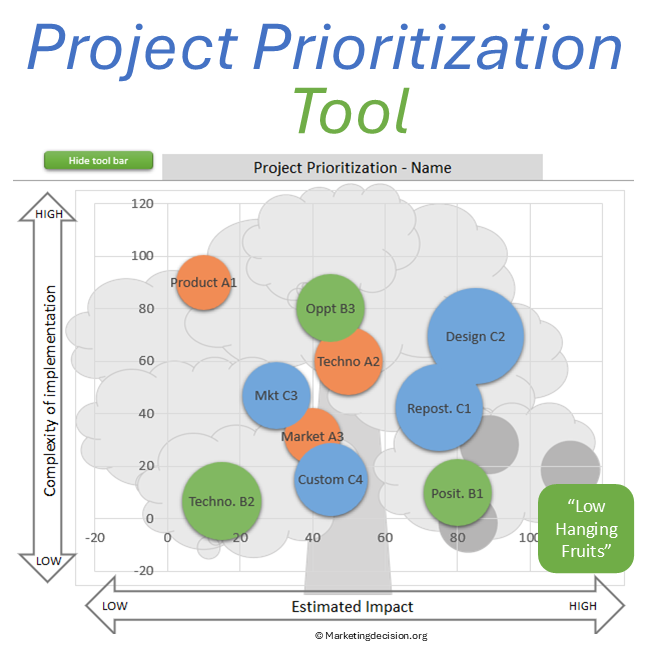
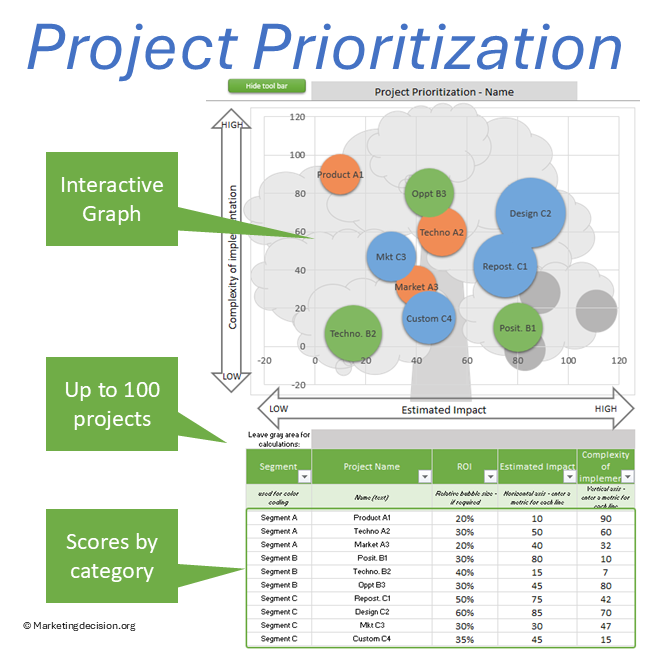
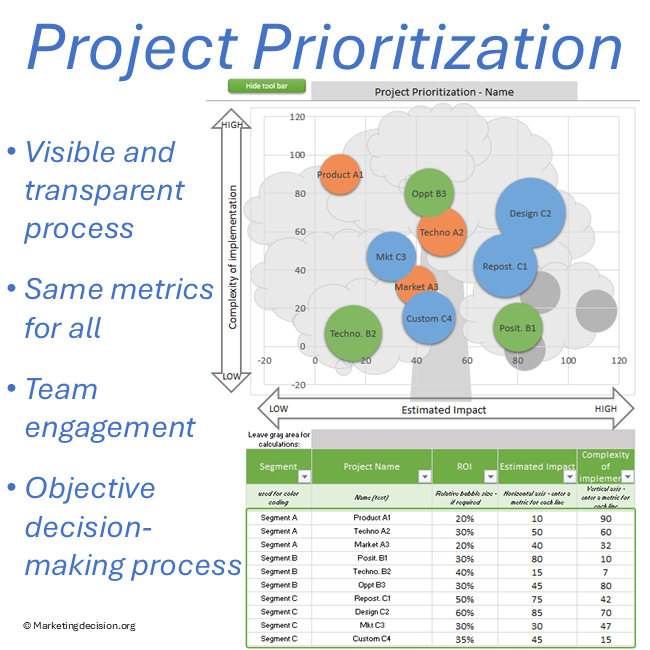
A project prioritization tool is a structured method used to compare multiple initiatives based on defined criteria such as impact, complexity, and return on investment. It provides a consistent framework to evaluate projects and support objective decision-making.
Organizations often face more opportunities than they can execute. Without a structured prioritization approach, decisions may become fragmented, short-term oriented, or influenced by subjective preferences.
Using a project prioritization tool helps align teams, compare initiatives consistently, and focus resources on the most valuable opportunities.
This project prioritization tool is based on a visual matrix:
This representation helps identify:
The Excel tool simplifies comparisons between projects or actions by providing visual capabilities to assess, discuss, and prioritize them.
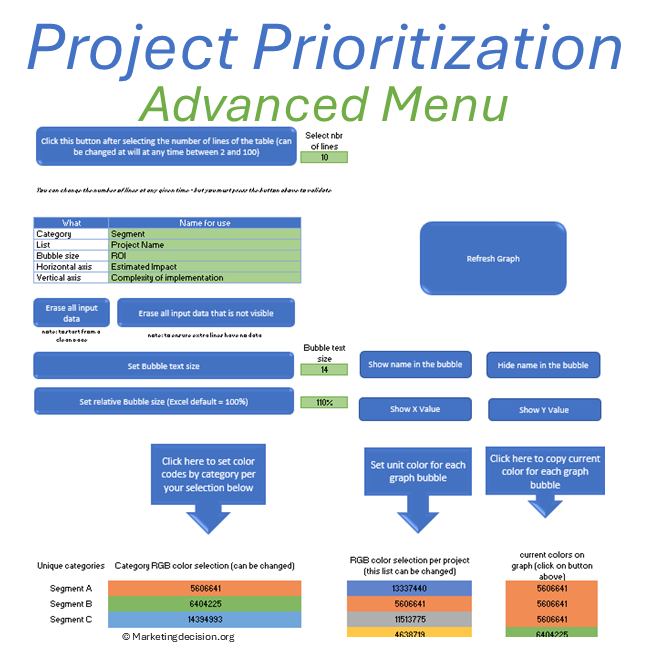
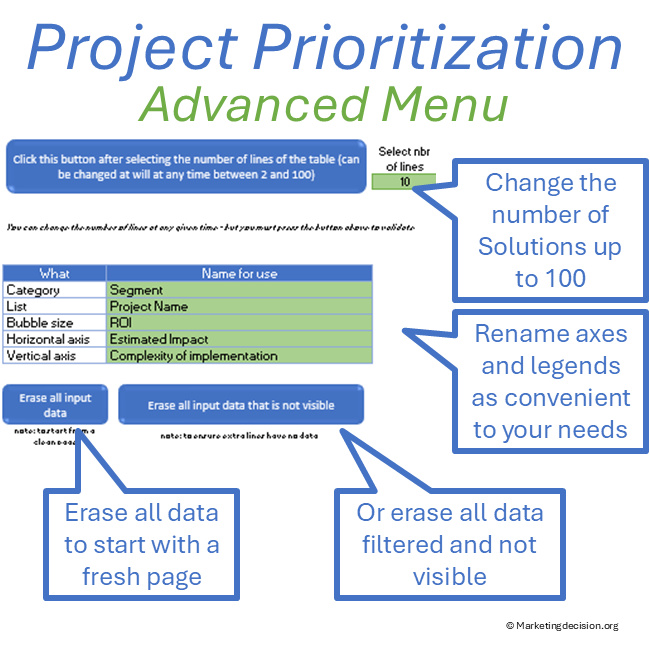
The number of solutions for comparison can range from 2 up to 100. They can be organized by category (e.g., market segments, initiatives, business units). Excel filters can be utilized to display only selected ones.
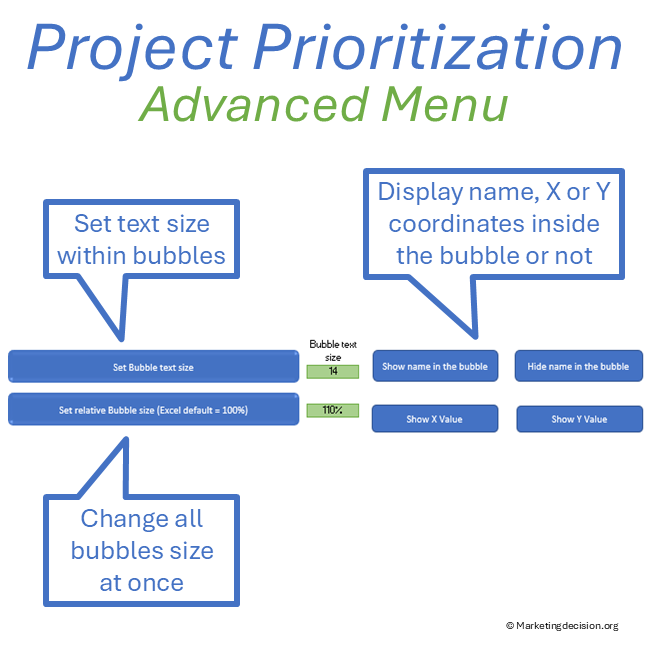
Color coding can be adjusted, as well as the size of “bubbles” used to represent each project.
The initial setup allows:
The bottom-right quadrant typically represents the most attractive projects.
Axes and parameters can be renamed depending on the context.
Prefer a quick visual overview before exploring the features?
Key features of this project prioritization tool include:
Follow these steps:
Use the tool to compare initiatives and structure prioritization discussions.
Evaluate investments based on impact, complexity, and ROI to support resource allocation.
Align projects with business objectives and long-term priorities.
Select the green button “Show Toolbar” to display the advanced features on the left in the toolbar (click again to hide it):
Note:
For a visualization where the top-right quadrant is most desirable, invert the vertical axis so that complexity decreases upwards while impact increases to the right. The background tree image should then be removed.
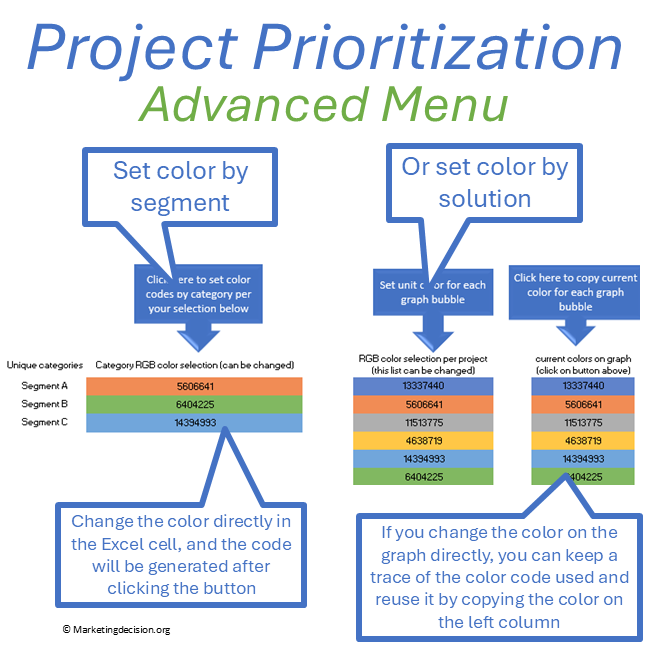
Category-based coloring:
Project-level coloring:
Copying color codes:
This project prioritization tool is designed for:
It is particularly useful in B2B environments where multiple stakeholders contribute to project selection and prioritization.
Project prioritization becomes more meaningful when aligned with solution value, pricing potential, and selling impact. For this overall framework, visit our Solution Mix page.
Campaign prioritization becomes clearer when tied to promotion objectives. Refer to Promotion Strategy for alignment with communication goals.
Prioritization works best when anchored in a clear WHY. See the Decision Mix for the principles behind structured choices.
Purchase and use of the application are subject to the applicable General Sales Conditions.
General Sales Conditions — English
Conditions Générales de Vente — Français
We use cookies to improve your experience on our site. By using our site, you consent to cookies.
Manage your cookie preferences below:
Essential cookies enable basic functions and are necessary for the proper function of the website.
These cookies are needed for adding comments on this website.
Stripe is a payment processing platform that enables businesses to accept online payments securely and efficiently.
Service URL: stripe.com (opens in a new window)
Statistics cookies collect information anonymously. This information helps us understand how visitors use our website.
Google Analytics is a powerful tool that tracks and analyzes website traffic for informed marketing decisions.
Service URL: policies.google.com (opens in a new window)