The Pugh Matrix Excel tool helps teams compare alternative solutions using structured evaluation criteria to support sound decision-making.
The Pugh Matrix, also known as a decision matrix for comparing alternatives, is widely used in engineering design, product development, and project evaluation. It helps teams systematically compare solutions across multiple criteria in order to identify the most balanced option.
The Pugh decision matrix highlights strengths and weaknesses across options, making it easier to support collaborative decision-making. Scorecards are powerful tools for comparing solutions or projects, and they facilitate important discussions where multiple viewpoints are typically shared. They provide a rational environment for stakeholders to make, justify, and communicate decisions more effectively, particularly when trade-offs and potential showstoppers must be discussed.
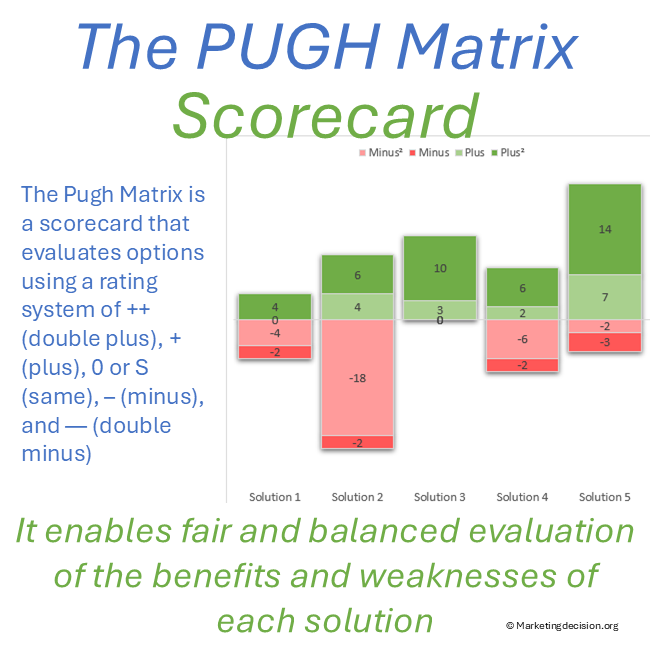
The PUGH matrix, named after its inventor Stuart Pugh, is a decision scorecard that uses discrete levels such as – – (double minus), -, 0 or S (same), +, and ++ (double plus) to compare solutions. The Excel tool applies this methodology to identify strengths and weaknesses, highlight significant advantages or disadvantages, and support structured comparisons across multiple criteria and solutions.
Designed for professional use, this application is provided as an Excel file and is available in English for companies and professionals.
To view images, click the magnifying glass icon in the top right corner of the image, or browse through the image carousel below.
© marketingdecision.org
€23.00 Exc. VAT
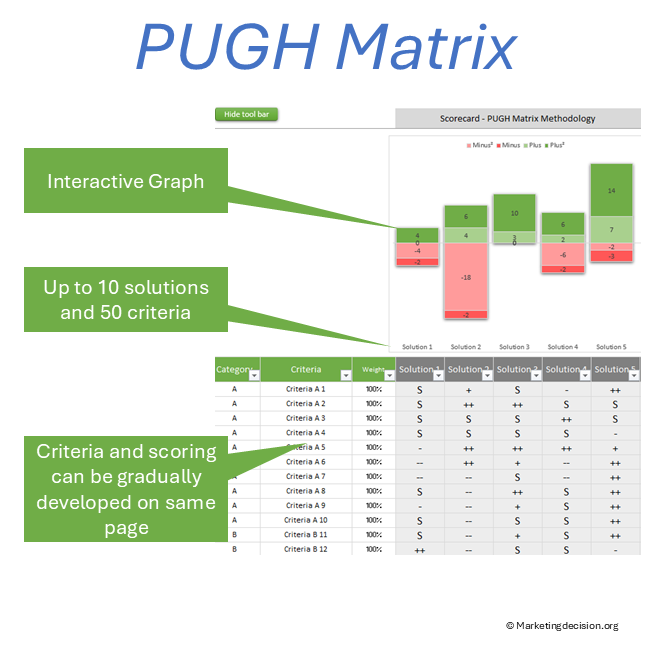
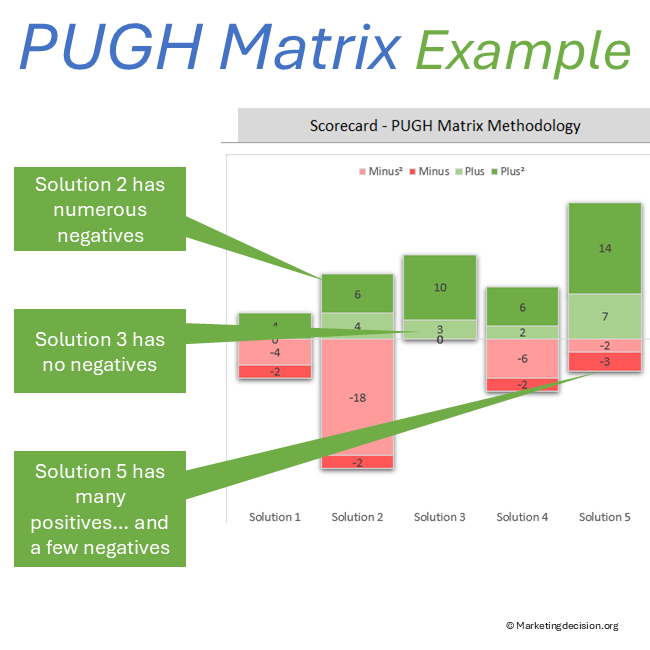
This Pugh Matrix Excel tool allows teams to compare solutions or projects using the PUGH matrix methodology. Both strengths and weaknesses can be identified clearly during the evaluation process.
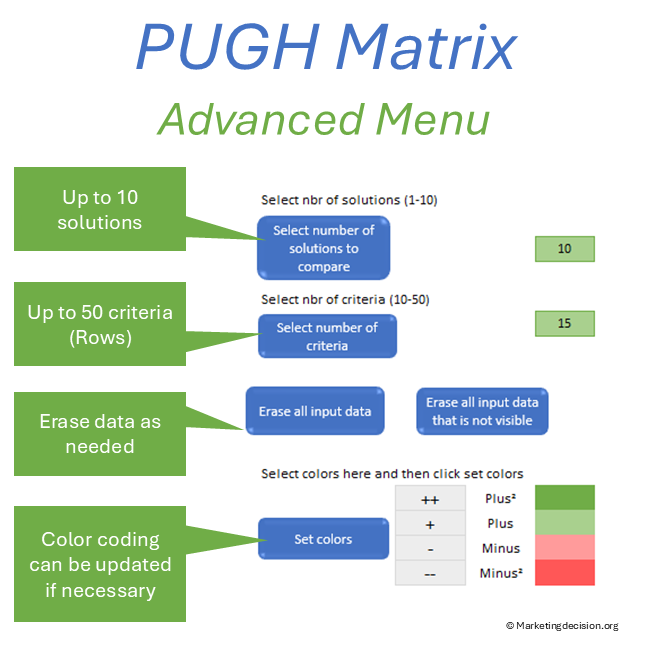
The number of solutions for comparison can be set from 1 up to 10, while the number of evaluation criteria can be adjusted from 10 up to 50. Color coding can be customized through the toolbar, allowing teams to visualize results more effectively and adapt the display to their preferences.
Traditional scorecards usually combine weighted scores into a single final result. The PUGH matrix, by contrast, counts the number of positive and negative evaluations across criteria.
A solution with multiple “++” advantages may perform well overall, but the “- -” levels will also clearly highlight potential weaknesses. The real advantage of the PUGH matrix is that it allows teams to identify strengths as well as weaknesses across solutions, rather than hiding these differences within a single numerical score.
A decision must consider both strengths and weaknesses. A solution that performs extremely well on several criteria but very poorly on others may ultimately be less valuable than a solution that is better balanced across criteria. In practice, some criteria may represent critical constraints or showstoppers.
By clearly presenting double pluses and double minuses, the PUGH matrix facilitates discussions among team members regarding the benefits and limitations of each solution. This structured debate is one of the key reasons why the PUGH matrix is widely used in many decision-making situations.
Prefer a quick visual overview before exploring the features?
Compare up to 10 solutions across up to 50 criteria
Graphics display strengths and weaknesses with customizable color coding
Weight factors can be adjusted for each criterion (default set at 100%)
An advanced “Results” page provides additional calculations and rankings across criteria
Usage recommendations help ensure optimal application of the comparison methodology
The PUGH matrix can be implemented in a few simple steps and revisited during stakeholder meetings. This facilitates discussion of the arguments supporting different solutions and helps teams evaluate criteria sensitivity.
Building a decision scorecard involves more than simply preparing a spreadsheet and entering data. It requires engaging the relevant individuals, ensuring effective communication, and validating results collaboratively as the scorecard evolves.
For complex scorecards or decisions with significant impact, multiple meetings are often required. Efficient communication and teamwork are essential to ensure that the results are understood and accepted.
This step is crucial to ensure that the decision question is clearly defined. Stakeholders often have different needs and priorities, so they should be involved early in the process.
Ensure that there is a project sponsor and that the team’s recommendations can be properly reported. Discussions at this stage often reveal new considerations as individuals learn more about the needs and constraints of others.
List objectives, scope, and team members to ensure the project remains aligned with priorities. If necessary, return to this step later in the process; refining the scope can improve the quality of subsequent analysis.
The list of evaluation criteria may include many dimensions, some technical and others strategic or operational.
Develop the criteria list by identifying the factors that are critical for selecting between solutions. Gathering input from the team helps ensure that all relevant criteria are considered.
Questions such as “What does success look like?” or “What issues must be resolved?” can help identify Critical-to-Quality (CTQ) criteria.
For example, when selecting a CRM system, criteria might include:
features and capabilities
ease of implementation
ease of deployment and training
cost and service
vendor support
Weight factors can be used to adjust the relative importance of criteria. Starting with a default weight of 100% is often sufficient before making further adjustments.
Once the criteria list is established, the next step is to populate the comparison table.
List the solutions and evaluate them using the comparison indicators:
– -, -, S (same), +, ++
If one of the solutions represents the current solution, assign “S” (same) across the column as the baseline reference. If no solution currently exists, select one option as the reference solution and adjust the evaluations accordingly.
The comparison can be performed:
criterion by criterion
solution by solution
Color coding can help identify criteria that require additional analysis or clarification.
After completing the comparison table, stakeholders should take time to review and interpret the results.
Consider testing hypothetical scenarios to evaluate how different weight factors might influence the comparison.
Discuss the strengths and weaknesses of each solution, which is the true strength of the PUGH matrix. Positive and negative evaluations remain visible rather than being merged into a single score.
Once the team is confident with the results and criteria weights, the final question becomes clear:
What conclusions can be drawn from the comparison?
After downloading the tool, save a copy for future use. A new copy should be created each time the tool is used, in accordance with the terms of use.
On the “Comparison” page, select “Show Toolbar” to access multiple parameters:
Select number of solutions (maximum 10, although 5–6 is often optimal)
Select number of criteria (maximum 50)
Buttons to erase the entire table or hidden cells
Set colors to customize visual comparison
Option to hide the toolbar once configuration is complete
You have full access to the macros, allowing you to adapt or extend the tool as needed. Suggestions for future improvements are welcome.
Campaign prioritization becomes clearer when tied to promotion objectives. Refer to the Promotion Strategy framework for alignment with communication goals.
Comparison frameworks depend on shared evaluation criteria. Visit the Decision Mix to explore the foundations behind structured comparison.
Purchase and use of the application are subject to the applicable General Sales Conditions.
General Sales Conditions — English
Conditions Générales de Vente — Français
We use cookies to improve your experience on our site. By using our site, you consent to cookies.
Manage your cookie preferences below:
Essential cookies enable basic functions and are necessary for the proper function of the website.
These cookies are needed for adding comments on this website.
Stripe is a payment processing platform that enables businesses to accept online payments securely and efficiently.
Service URL: stripe.com (opens in a new window)
Statistics cookies collect information anonymously. This information helps us understand how visitors use our website.
Google Analytics is a powerful tool that tracks and analyzes website traffic for informed marketing decisions.
Service URL: policies.google.com (opens in a new window)