Risk and Opportunity Matrix Excel Tool

Assess, compare, and prioritize risks and opportunities based on impact and probability — then decide where action matters most.

Map real events on a visual matrix instead of simply assigning them to colored risk levels. Compare risks and opportunities in the same view, focus discussions on what matters, and turn uncertainty into clearer priorities.

Designed for professional decision-making in Excel, the tool helps teams structure discussions around market changes, competitive moves, customer developments, technology, projects, and other uncertain events.

Excel for Windows · Up to 100 events · Customizable matrix · Full access to embedded macros

© marketingdecision.org

€22.00 Exc. VAT

SKU DT-ROT-01 Category

Risk and Opportunity Matrix Tool

Want to understand the method before using the tool?

See how the Risks and Opportunities Matrix methodology works in practice.

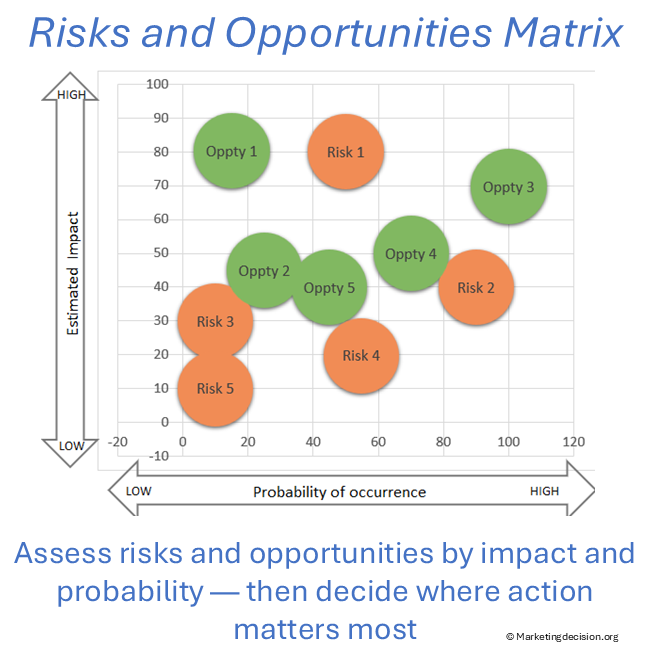
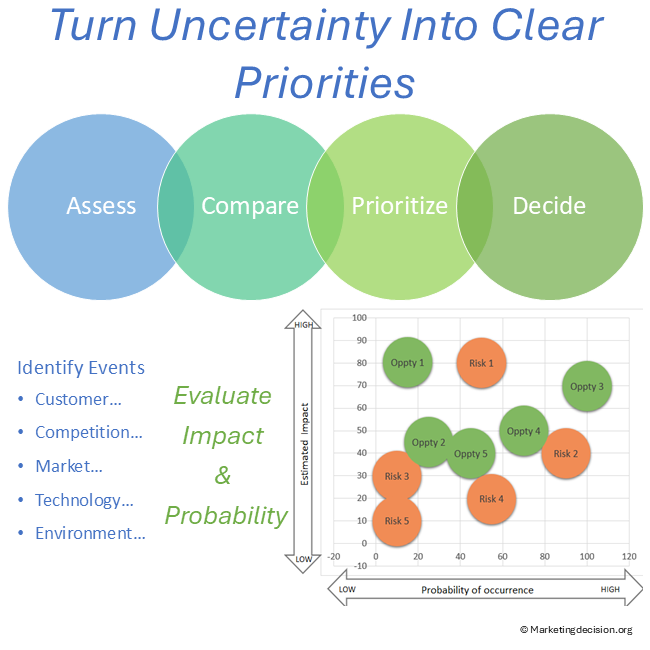
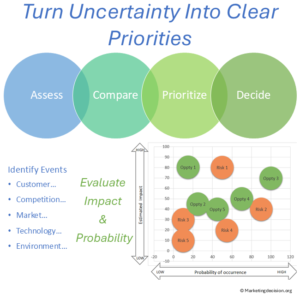
Risk and Opportunity Matrix showing how to assess, compare, prioritize and decide

Turn Uncertainty Into Clear Priorities

Risks and opportunities rarely arrive neatly ranked. A new competitor, changing customer demand, emerging technology, regulation, or market disruption can all affect the business differently.

The challenge is not simply to identify these events. It is to determine which deserve attention and what should happen next.

The Risk and Opportunity Matrix helps you evaluate events using two understandable dimensions — impact and probability — and position them together in a visual landscape.

You can then compare events, identify priorities, and focus the discussion on the decisions that matter.

From a list of uncertain events to a shared view of priorities.

Assess. Compare. Prioritize. Decide.

Assess

Identify the risks and opportunities that could affect your objectives.

Evaluate each event according to its potential impact and probability of occurrence. The objective is not to create a perfect forecast, but to establish a consistent basis for discussion and comparison.

Compare

Bring risks and opportunities together in the same visual framework.

Instead of reviewing isolated scores or separate lists, see how events relate to one another. Their position on the matrix makes differences in impact and probability immediately visible.

Prioritize

Identify the events that deserve the greatest attention.

The matrix helps teams move beyond long lists of risks and opportunities and focus discussions on the events most likely to influence future decisions.

Decide

Use the resulting picture to discuss where action is required.

Mitigate important risks. Explore valuable opportunities. Monitor uncertain developments. And align people around what deserves attention now.

The method is simple. The application makes it practical.

More Than a Colored Risk Matrix

Many risk matrix templates use a fixed 3×3 or 5×5 grid to classify risks into predefined color zones.

That can be useful for basic risk classification. But it provides a limited view when you need to compare individual events, include opportunities, and support a real decision discussion.

The Risk and Opportunity Matrix Tool takes a different approach.

Each event is positioned individually according to its impact and probability, allowing you to see the relative position of risks and opportunities across the complete matrix.

This gives you a visual decision landscape rather than simply a colored classification table.

What You Can Do With the Risk and Opportunity Matrix Tool

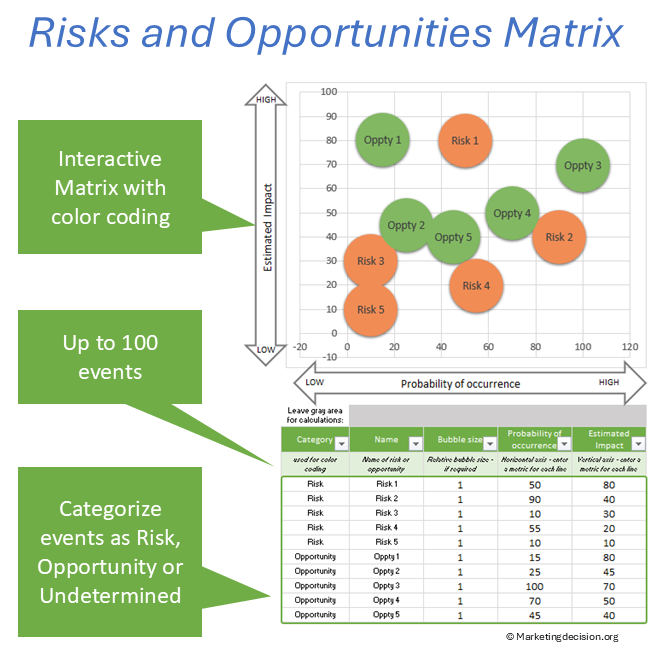
Map Up to 100 Events

Build a structured list of risks, opportunities, or uncertain events and display the selected events directly on the matrix.
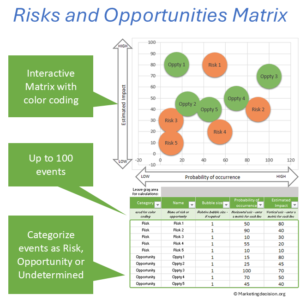
Excel Risk and Opportunity Matrix showing categorized events by impact and probability

Evaluate Impact and Probability

Use customizable scales to position events according to their estimated impact and probability of occurrence.

See Risks and Opportunities Together

Categorize events as Risk, Opportunity, or Undetermined, or use categories that fit your own analysis.

This is particularly valuable because the same external development may represent a threat in one situation and an opportunity in another.

Focus the Discussion

Use the visual position of events to compare priorities and support discussions about where attention or action is required.

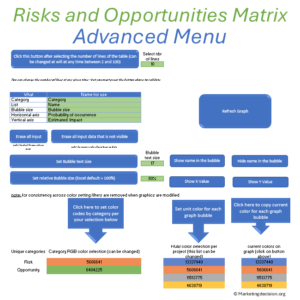
Adapt the Matrix to Your Context

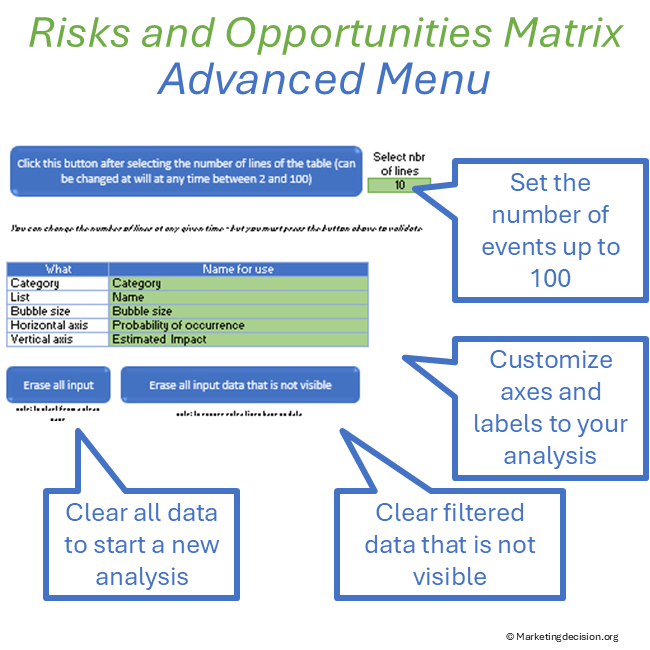
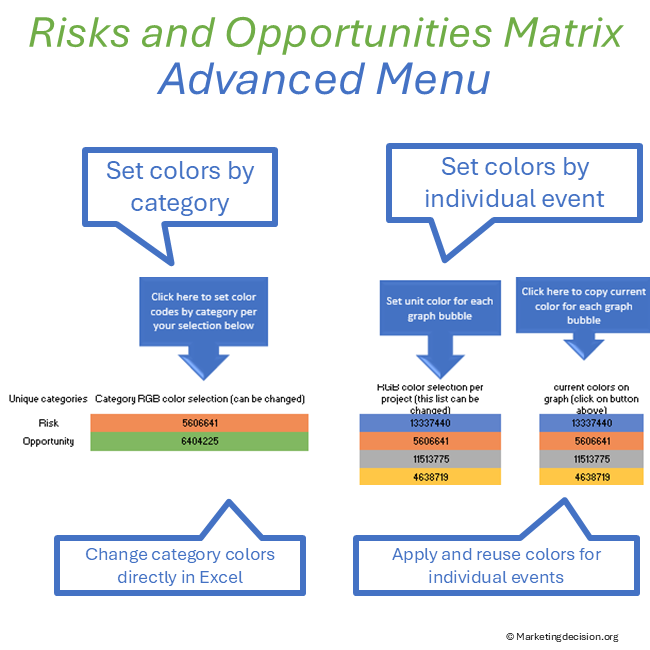
Customize axis definitions, labels, categories, display settings, and colors to reflect your analysis.
Designed for Real Business Decisions

The matrix can support decisions involving:

  • Market uncertainty — changes in demand, regulation, economic conditions, or market structure
  • Competitive developments — new entrants, competitor moves, substitutions, or changing positions
  • Growth opportunities — new segments, geographies, partnerships, technologies, or applications
  • Strategic initiatives — compare uncertainties affecting projects, investments, or business priorities
  • Cross-functional decisions — establish a shared picture when different teams perceive risks and opportunities differently

The objective is not to predict the future perfectly. It is to make uncertainty discussable.

Explore the Excel Application

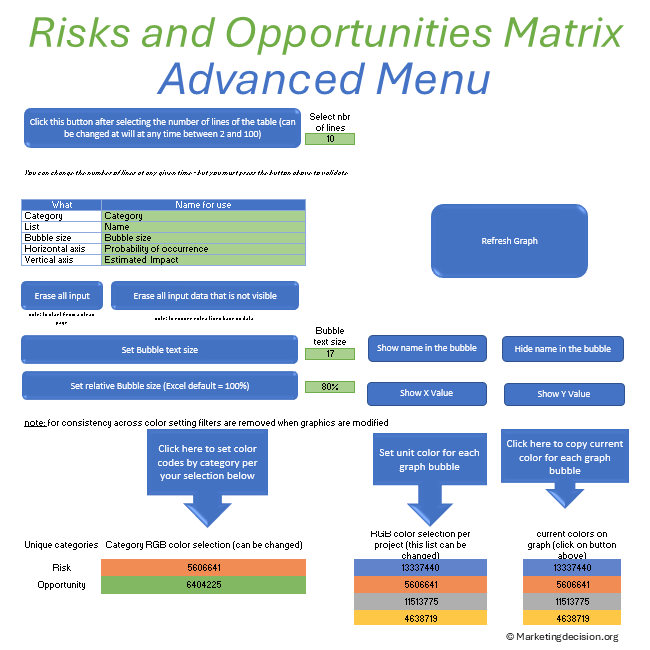
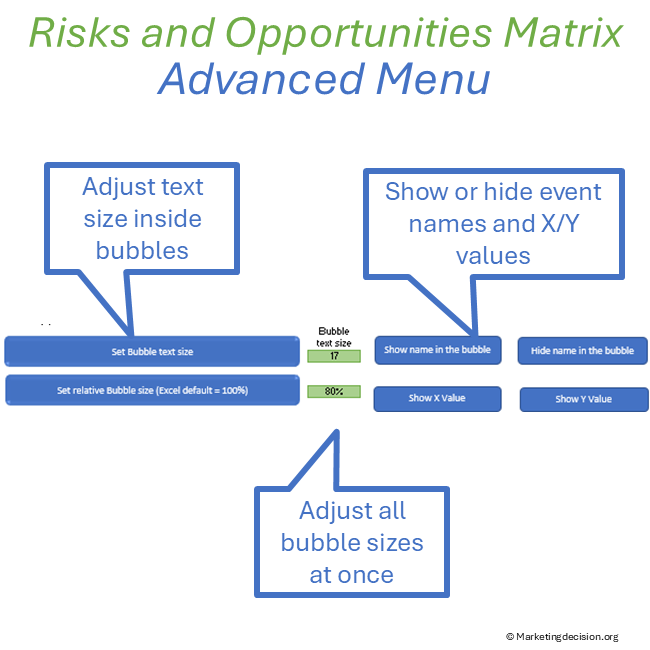
Risk and Opportunity Matrix Excel advanced settings for display, labels and colors

The methodology provides the framework. The Excel application makes the method practical in a real discussion.

Enter your events, assess impact and probability, choose what to display, and the matrix updates the visual picture.

Interactive Matrix

Display selected events on an impact-versus-probability matrix and update the visualization as your assessment changes.

Event Selection and Filtering

Work with 2 to 100 events and filter categories to concentrate the analysis on selected risks, opportunities, projects, business areas, or scenarios.

Display Controls

Show or hide event names, adjust text size, change the overall bubble display size, and display axis values according to the needs of the discussion.

Customizable Categories and Colors

Use colors to distinguish risks, opportunities, undetermined events, or your own categories.

Customizable Excel Application

Adjust axis definitions, legends, input ranges, categories, and visualization settings.

You also have access to the embedded macros, allowing the application to be adapted further when required.
See the Tool in Action

Watch the Risk and Opportunity Matrix Tool Demo

See how events are entered, assessed, positioned on the matrix, filtered, and displayed to support a risk and opportunity discussion.

Risk and Opportunity Matrix: Methodology and Tool

Want to go deeper into the approach behind the application?

The Risk and Opportunity Matrix methodology explains the reasoning behind assessing and comparing uncertain events. The Excel tool puts that approach into practice.

Learn the Risk and Opportunity Matrix Methodology

Frequently Asked Questions

What is a risk and opportunity matrix?

A risk and opportunity matrix is a visual framework for assessing uncertain events according to dimensions such as impact and probability. It helps compare risks and opportunities and identify which events deserve greater attention.

Assess each event consistently using impact and probability, then compare their relative positions. Events with greater potential consequences or likelihood generally deserve more attention, while the business context determines the appropriate response.

Yes. Assessing both on the same framework provides a more balanced view of uncertainty. It helps prevent discussions from focusing only on threats while overlooking developments that could create value.

No. The tool positions individual risks and opportunities on a continuous visual matrix rather than simply assigning them to fixed colored cells. This makes relative differences between events easier to see and discuss.

Yes. The application requires Microsoft Excel on Windows and uses functionality available in Microsoft 365 and compatible recent Excel versions.

Yes. Axis definitions, labels, categories, display settings, and colors can be customized. The embedded macros are also accessible for users who want to adapt the application further.

Product Requirements and License

Requirements

  • Microsoft Excel for Windows
  • Microsoft 365 or a compatible Excel version supporting the required dynamic-range functionality

Download & Use

  • For professional use — see Terms and Conditions below
  • Download link valid for 2 months
  • Up to 10 downloads
  • Embedded macros accessible for customization
  • Branding, trademarks, and references must remain visible

Terms and Conditions

Purchase and use of the application are subject to the applicable General Sales Conditions.

General Sales Conditions — English
Conditions Générales de Vente — Français

Put the Risk and Opportunity Matrix Into Practice

Assess risks. Reveal opportunities. Compare what matters. Decide where to act.

Use the Risk and Opportunity Matrix Tool to turn a list of uncertain events into a visual framework for discussion and decision-making.