The innovation matrix Excel Tool presented here helps teams compare product vs technology innovation options and structure strategic development decisions.
When investing in product and solution development, companies must choose between different innovation paths – enhancing product features, investing in new technologies, or combining both. These decisions directly impact competitiveness, risk levels, and time to market.
This innovation decision framework provides a clear visual framework to position projects, assess complexity, and support structured discussions on innovation strategy and investment priorities. This tool can be used as an innovation matrix, a portfolio analysis tool, and a decision-making framework for innovation strategy.
Designed for professional use, this application is provided as an Excel file and is available in English for companies and professionals.
To view images, click the magnifying glass icon in the top right corner of the image, or browse through the image carousel below.
© marketingdecision.org
€22.00 Exc. VAT
Innovation decisions are often difficult because they involve trade-offs between market needs, technical feasibility, and investment constraints.
A structured innovation matrix helps teams:
Without a clear framework, innovation decisions often rely on partial information or short-term considerations. This tool helps bring structure, visibility, and alignment to these discussions. It is particularly useful for product managers, innovation teams, and strategy leaders who need to align decisions and prioritize investments.
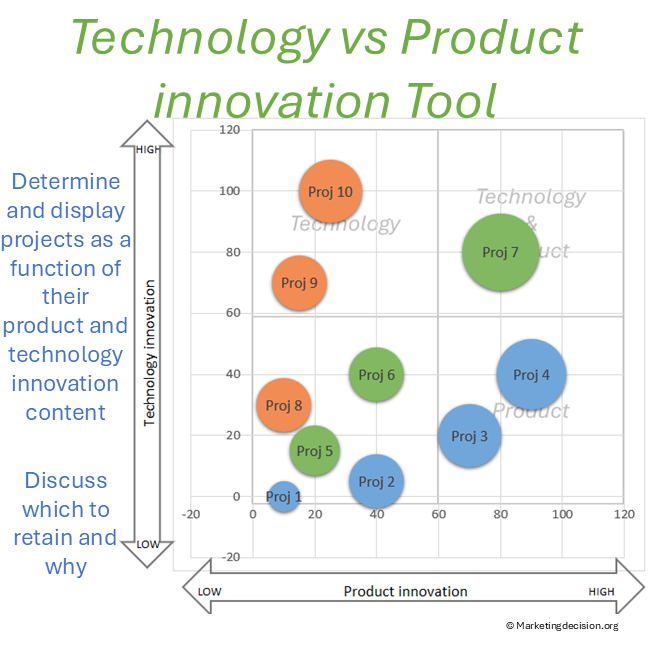
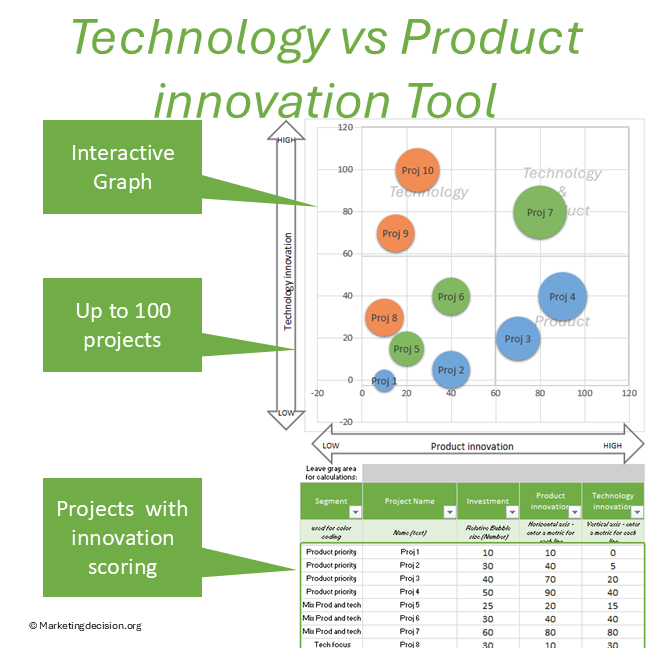
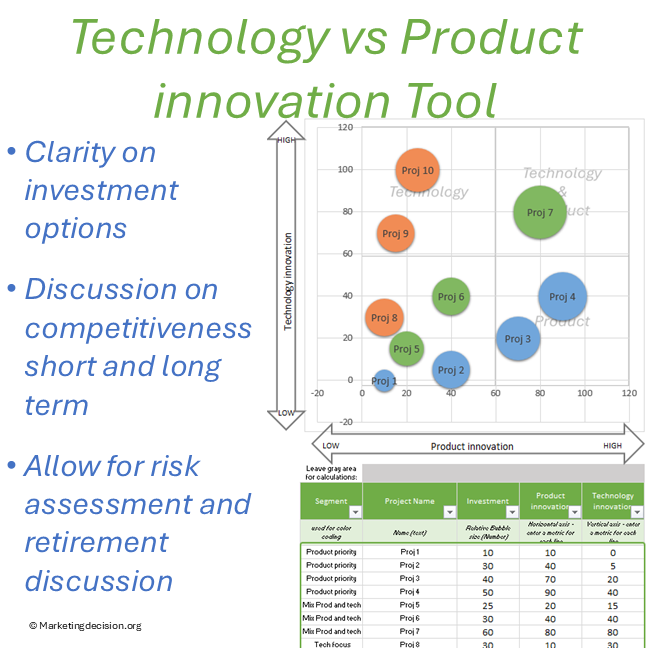
This innovation matrix tool is based on two axes representing the degree of change required in product features and in technology.
Each project is positioned on the matrix based on these two dimensions.
This visualization helps teams:
In addition, each project is represented by a bubble, where size reflects the relative level of investment. This allows teams to visualize not only positioning but also resource allocation.
Prefer a quick visual overview before exploring the features?
The technology vs product innovation matrix Excel tool includes the following features:
The horizontal axis represents changes in product features and capabilities. This dimension focuses on improving competitiveness through better product positioning, enhanced features, or faster time to market.
The vertical axis represents changes in technology. Investments in this dimension may improve cost efficiency, enable new capabilities, or create long-term competitive advantages.
Each project is positioned based on its level of product and technology innovation. Bubble size represents the relative level of investment. If investment is not yet defined, a uniform value can be used for comparison.
Important: The definition of both axes must be clearly established and shared among team members. A common understanding ensures consistent evaluation and meaningful discussions.
Understanding how projects are distributed across the matrix helps teams identify innovation strategies, potential development paths, and investment priorities over time.
The innovation matrix Excel template is designed to be simple and practical:
This process helps teams align on priorities and make more informed innovation investment decisions.
This tool can be considered an innovation portfolio matrix that supports strategic decision-making.
It complements other decision-making frameworks by focusing specifically on the balance between product and technology innovation. By visualizing different options, teams can better understand how to allocate resources and manage risk.
Innovation choices are rarely isolated. A sequence of projects over time may define a broader innovation strategy, where product and technology investments interact to build sustainable competitive advantage.
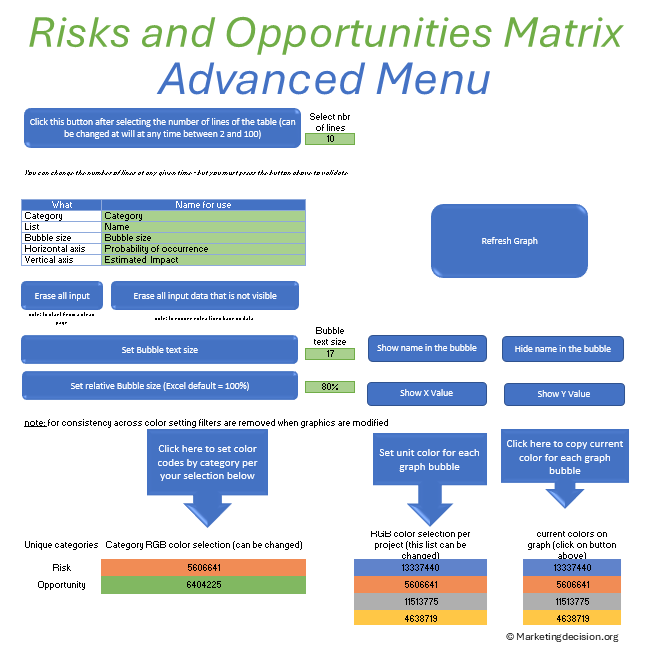
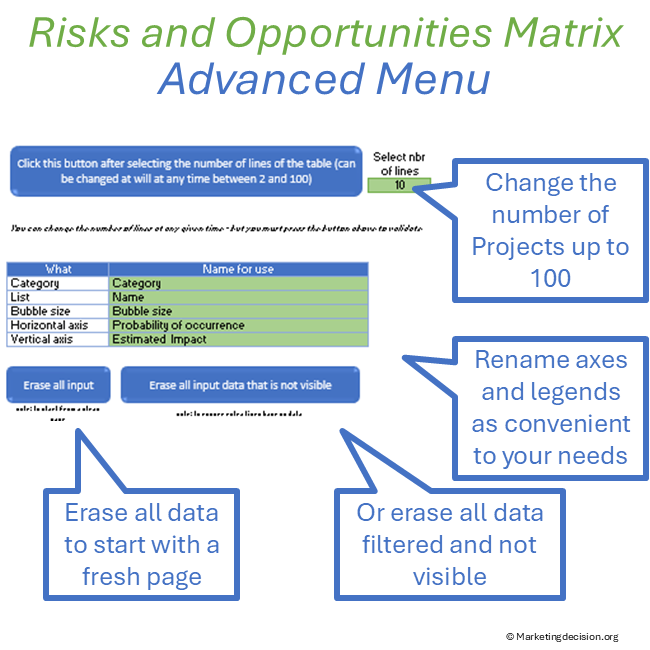
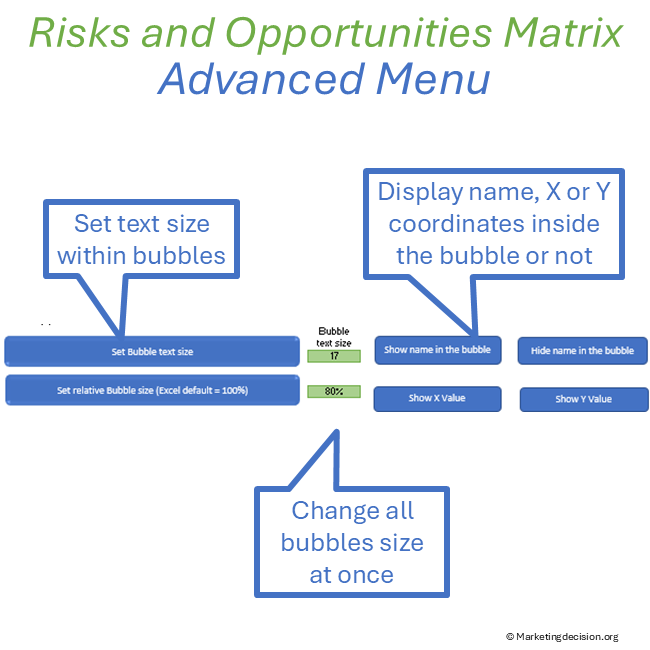
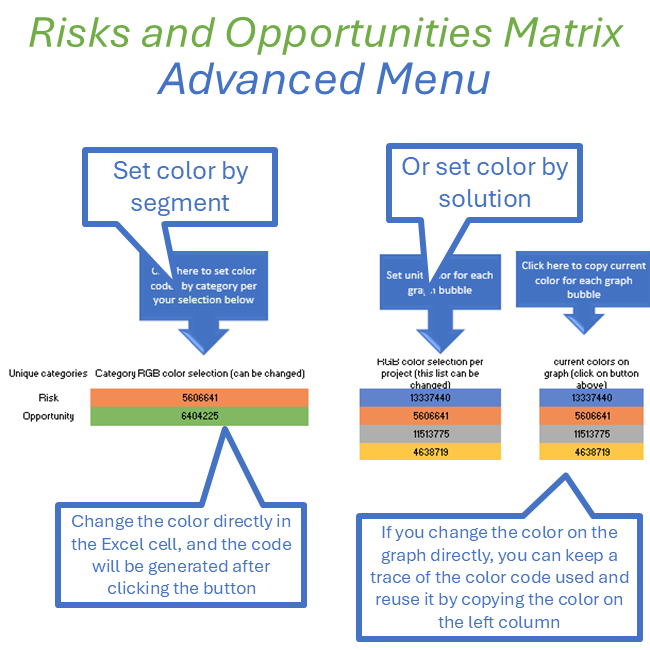
Select the green button “Show Toolbar” to display advanced features:
Data Selection
Legends and Display
Color Customization
Users have full access to macros and can adapt the tool to their needs.
This innovation matrix tool builds on the principles described in our:
Purchase and use of the application are subject to the applicable General Sales Conditions.
General Sales Conditions — English
Conditions Générales de Vente — Français
We use cookies to improve your experience on our site. By using our site, you consent to cookies.
Manage your cookie preferences below:
Essential cookies enable basic functions and are necessary for the proper function of the website.
These cookies are needed for adding comments on this website.
Stripe is a payment processing platform that enables businesses to accept online payments securely and efficiently.
Service URL: stripe.com (opens in a new window)
Statistics cookies collect information anonymously. This information helps us understand how visitors use our website.
Google Analytics is a powerful tool that tracks and analyzes website traffic for informed marketing decisions.
Service URL: policies.google.com (opens in a new window)