Description
When Should You Use This Tool?
This Risk and Opportunity Matrix tool is particularly useful when:
- Assessing market uncertainty and external risks
- Identifying growth opportunities across segments or regions
- Prioritizing initiatives based on impact and likelihood
- Aligning cross-functional teams on key business priorities
- Preparing strategic or investment decisions
The Risk and Opportunity Matrix tool helps clarify the “why” behind priorities. Refer to the Decision Mix framework for the decision criteria that guide this tool.
What This Excel Tool Allows You to Do
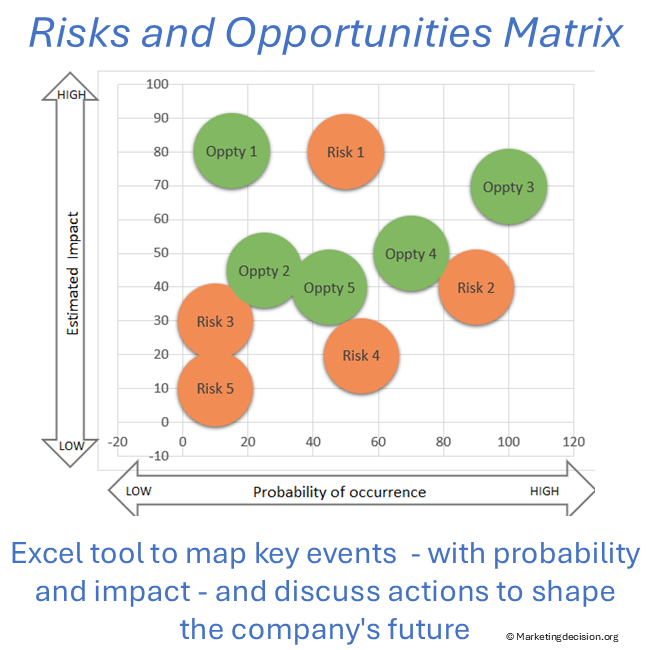
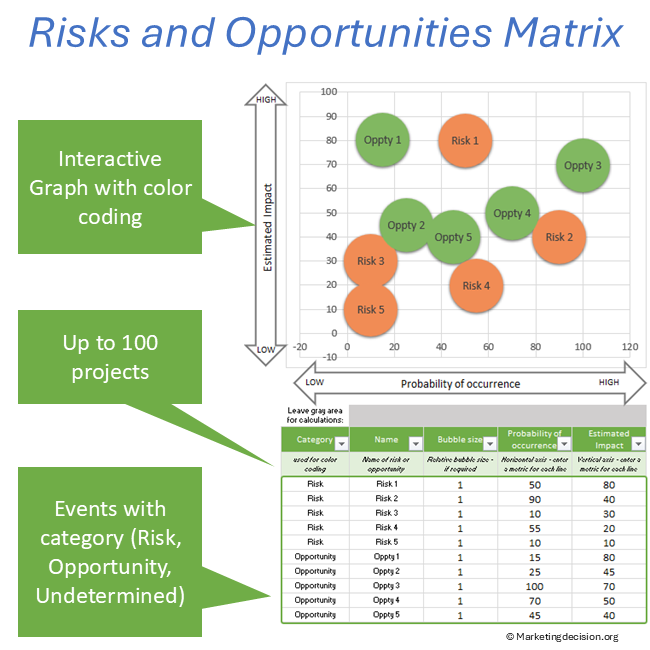
The template enables you to list, structure, and visualize risks and opportunities in a single framework based on two key dimensions:
- Impact: the potential effect on your business or market
- Probability: the likelihood of occurrence
By combining these two axes, the matrix highlights priority areas, especially events with high impact and high probability, so teams can focus their efforts where it matters most.
Prefer a quick visual overview before exploring the features?
Key Features of the Risk and Opportunity Matrix
- Map risks and opportunities on a bi-dimensional matrix (impact vs probability)
- Highlight key events using bubble size and visual emphasis
- Categorize events (positive, negative, undetermined, or by segment)
- Customize axes and scales to match your analysis context
- Filter and compare different scenarios or business areas
Risk vs Opportunity Matrix: Why Combine Both?
In many situations, the same event can represent both a risk and an opportunity depending on perspective, timing, or execution.
This tool allows you to assess both dimensions within the same framework, ensuring a balanced view and avoiding decision-making that focuses only on threats or only on gains.
How the Tool Works (Impact vs Probability)
Each event is positioned on the matrix using two scales:
- Probability (from low likelihood to high likelihood)
- Impact (from minimal to significant effect)
This relative evaluation helps teams compare events consistently and prioritize discussions, without requiring precise forecasting.
Additional Information
This application includes advanced features such as:
- Customizable data tables and input ranges
- Flexible visual display options (bubble size, labels, colors)
- Editable axes definitions and category filters
- Access to underlying macros for customization
Advanced Features
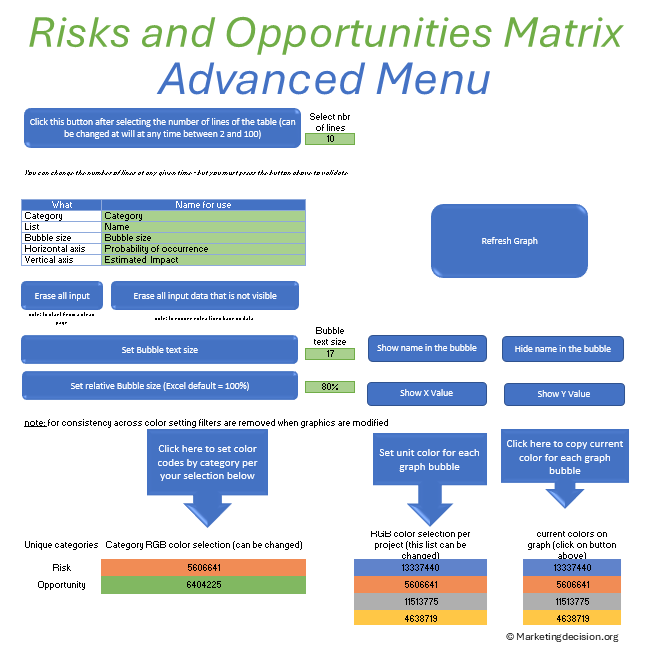
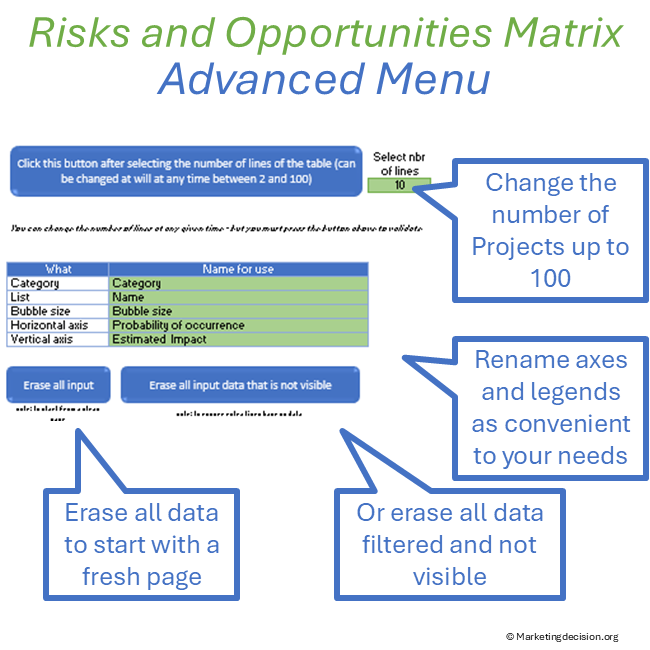
Data Selection
- Select the number of lines for the table (from 2 to 100)
- Set names for axes and table legends
- Filter the category column to display selected projects
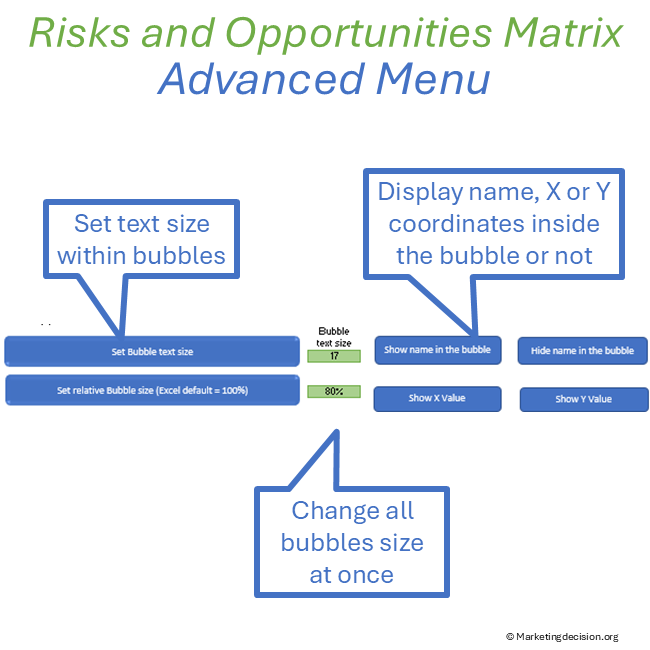
Legends Capabilities
- Show or hide names on graph bubbles
- Set bubble text size
- Adjust relative bubble size
- Display horizontal and vertical axis values
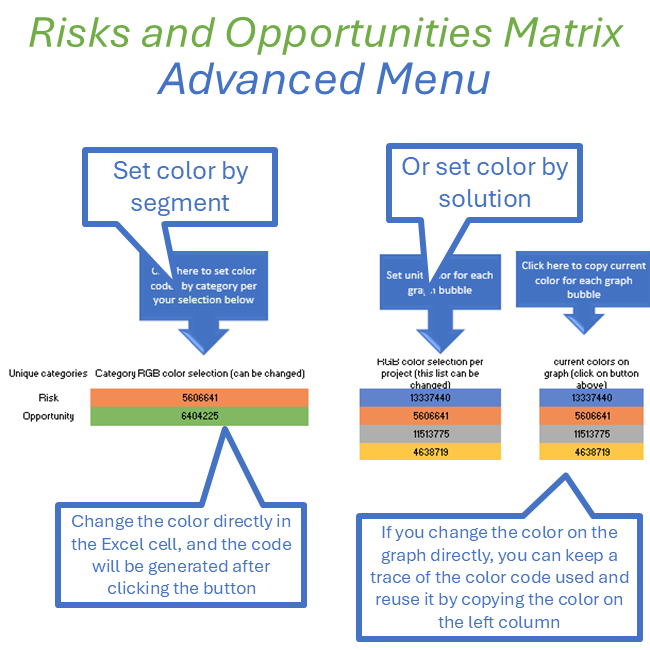
Changing Color Schemes
- Set colors based on categories
- Assign individual colors to each graph bubble
Note: You have full access to the macros, allowing you to adapt or extend the tool based on your needs.
Usage & Licensing
This product is intended for professional use only. Please review the Sales Conditions to fully understand your rights and usage limitations.
Licensed for a single business unit (up to 100 employees)
Additional licenses required beyond this scope
Download link valid for 2 months
Up to 10 downloads allowed
Users have full access to the application, including embedded macros, and may adapt it to their needs. However, all branding, trademarks, and references must remain visible and unchanged.
Ensure that you have Microsoft Excel and a PC running Windows before purchasing this application. This application uses advanced dynamic range calculations introduced by Microsoft. Please ensure that you are using a compatible version of Excel, such as Microsoft 365, or any version released after Excel 2019 which supports this feature.
We appreciate your feedback on how to improve this application. Feel free to share your suggestions with us at contact@marketingdecision.org