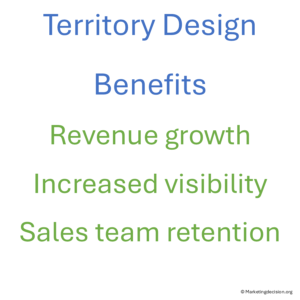
 The development of local performance metrics brings significant advantages to territory design. One of the most important benefits is the ability to estimate local market share and sales visibility.
By analyzing deals won by your company and your competitors—using data from an effective Customer Relationship Management (CRM) system—you can estimate local market share and gain key marketing insights.
Understanding which sales territories are too large or too small is essential. This is where you identify markets that are under-addressed, where potential sales are being left on the table because territories are too large and salespeople meet their targets too easily. On the opposite, you also identify where territories are too small, preventing salespeople from achieving fair targets and potentially pushing them to leave for competitors.
 It is often said that an optimized Go-to-Market strategy can increase revenue by 4% to 8% compared to an unoptimized one. This is easy to understand if you have ever lost an experienced salesperson under pressure to reach targets that were simply unattainable given their territory potential.
Similarly, you may have discovered a salesperson with excellent results and high order volumes who, in fact, had a significantly larger territory than their peers. Unbalanced territories are a common source of inefficiency and disengagement.
However, achieving balance is not just about equal distribution. Aligning territories solely based on market potential—giving everyone an equal number of customers or opportunities—is not efficient either. Some areas require greater effort because of travel time or stronger local competition. In other cases, more junior salespeople may need smaller territories or lighter targets initially.
Multiple factors must be weighed to ensure market coverage is both efficient and fair.
Not aligning sales territories properly leads to two serious issues:
The Go-to-Market strategy reflects the priorities set in the marketing plan, defining which market segments will be targeted and how.
In this context, several strategic business questions arise:
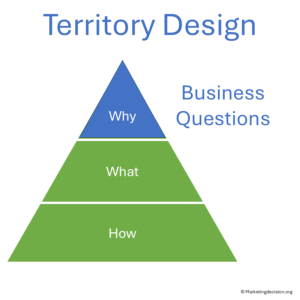
These questions stem from the market assessment within the marketing mix. Identifying threats and opportunities helps shape the marketing plan and the overall go-to-market strategy.
Aligning the sales organization to the market is therefore one of the most essential components of successful business execution.
 Multiple criteria can guide sales territory alignment, but three stand out as particularly critical: fairness, flexibility, and sustainability. Additional factors such as integration, education, and communication play a key role in ensuring alignment across both sales and support functions. Implementation costs and long-term management must also be carefully addressed.
Fairness
Fairness ensures that sales territories are distributed equitably across all salespeople.
Creating territories that are too large with easy targets or too small with impossible ones quickly undermines confidence. Over time, this can lead to turnover and the loss of valuable sales expertise and customer knowledge.

A fair distribution process requires transparency. Every step in constructing the territories should be communicated clearly, and salespeople should be encouraged to discuss challenges and constraints openly. Ensuring fairness in both territory allocation and target setting is fundamental to a successful sales organization.
Flexibility
Flexibility is equally important. Unexpected events—whether internal or external—can affect the balance of territories.
Organizations need to be able to adjust quickly when the situation changes. Appropriate tools, such as territory planning software, allow managers to make recalculations efficiently while communicating clearly with affected team members.
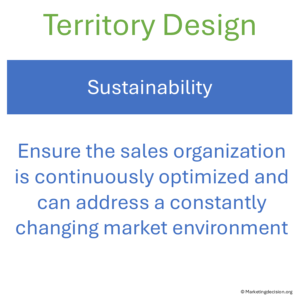
Sustainability
Sustainability ensures that territory optimization is not a one-time exercise.
A sales organization must continuously adjust to changing markets and competitive environments. By building sustainability into its territory design process—through data, fairness, and flexibility—an organization can maintain alignment and responsiveness over time.
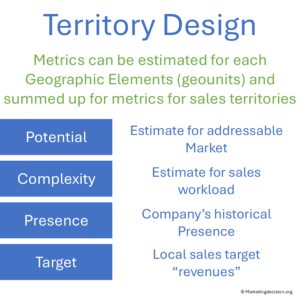 Delivering fair and effective territories requires evaluating several complementary dimensions: sales potential, territory complexity, presence, and targets. Together, these metrics allow for transparent and balanced territory design.
This metric estimates the addressable market within a given area. It goes beyond existing customers in your CRM and considers untapped opportunities. Understanding potential helps assess how much of the total market can be distributed among salespeople.
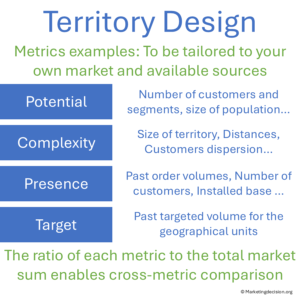
This metric estimates the workload associated with managing a territory.
It can represent the total effort (such as travel and meeting time) required to reach all potential customers. Complexity may also consider geographic spread, customer concentration, and logistical challenges.
This metric measures your company’s local market presence compared with competitors. Understanding where your loyal customers are—and where competitors dominate—helps identify local strengths and challenges. This dimension is key for defining localized strategies, whether to defend existing positions or pursue new opportunities.
This metric represents the sales target assigned to each territory. By comparing targets with potential, complexity, and presence, you can identify whether expectations are realistic. This also allows for data-driven recalibration if territories are redesigned in the future.
Measuring all four dimensions can be challenging, and continuous improvement based on feedback is necessary. Instead of relying on one indicator, using correlated metrics helps validate results. To explore how these metrics translate into visibility and performance analysis, see the Market Waterfall Tool and Strategic Position Analysis Tool on this site.
Sales territory optimization tools are often integrated with CRM systems, helping teams manage accounts and visualize performance by geography. This integration offers a significant advantage—clear visibility of account ownership and activity tracking.
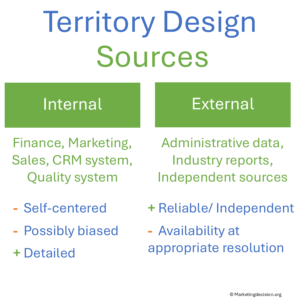
However, when relying solely on CRM data, results can be distorted by inconsistent reporting. Deals not logged in the CRM are excluded from the data, which affects estimates of potential and may even encourage underreporting. Reliable territory design therefore requires accurate and multi-source data integration.
When comparing tools, it is important to clearly define your needs and objectives. Build a scorecard to evaluate solutions and describe “what success looks like” for each stakeholder.
For related methods on evaluating market attractiveness and solution competitiveness, visit Value Ladder Tool for Solution Differentiation, and Strategic Position Analysis Tool for Market Attractiveness.
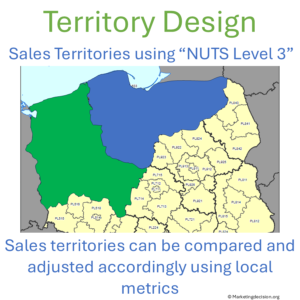
 Sales territories are typically structured by combining smaller geographic elements (sometimes called geounits). Metrics can then be aggregated from these elements to calculate total potential, complexity, and presence per salesperson.
The most common geographic units are ZIP codes, cities, and NUTS regions (in Europe). ZIP codes are particularly valuable because they align easily with customer addresses. However, in some cases, ZIP codes can be too granular or inconsistent. NUTS regions, by contrast, are administrative divisions with readily available demographic and business data.
Another approach involves grouping customers directly—especially where several clients are part of the same network and prefer a single contact. The best method depends on data availability, accuracy, and applicability to your business model.
When evaluating a solution, consider the following:
Will it integrate with your CRM to support activity tracking and local metrics?
There are many tools available for territory visualization and optimization.
They display maps with relevant sales metrics and make it easier to balance market potential and workload.
While some organizations may consider the salesperson’s residence in territory design, privacy regulations may restrict this in certain countries.
It is therefore important to choose a method compliant with local data protection standards.
Reliable CRM data remains essential, but combining it with external data sources—such as population, number of households, or administrative business data—can provide a more accurate picture of potential by region.
Effective tools should also enable the display of territories owned by multiple teams, such as account managers and specialists, to support multi-level analysis.
For examples of advanced geomarketing tools, see Galigeo and WIGeoGIS, two companies offering comprehensive solutions for sales territory planning.
 Understanding the market waterfall—from total market to addressed, quoted, and won opportunities—is essential to evaluate sales coverage and performance.
These metrics help reveal where your company has a strong local presence and where competitors hold a stronger position.
In practice, analyzing the market waterfall by territory allows management to identify coverage gaps and inconsistencies. It becomes clear where business is not being pursued as expected, where opportunities are underreported in the CRM, or where certain regions are left unaddressed. This is often where money is left on the table—territories may appear to perform well but still hide untapped market potential.
By comparing stages in the waterfall, sales leaders can challenge incomplete reporting, encourage more accurate CRM usage, and reinforce accountability. At the same time, the analysis highlights regions or customer segments that could be better addressed by the company, helping to prioritize local investments and resource allocation.

For both Sales and Marketing, the waterfall provides a unified view of market dynamics—clarifying how much of the total market is visible, quoted, and won, and where improvement is possible.
Used properly, it supports data-driven discussions on sales performance, visibility, and competitive positioning.
For a detailed illustration, see the Market Waterfall Tool page or watch the demo available on YouTube.
The Market Waterfall provides a comprehensive view of the market journey, from the total market perspective down to what is successfully captured at each step. 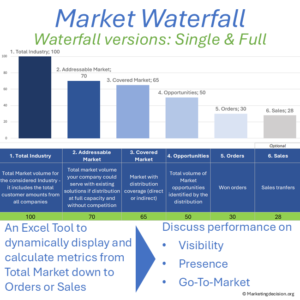 This tool is particularly beneficial when working through distributors, as it allows for independent data collection and analysis. It offers key insights to facilitate discussions on market presence, visibility and competitive positioning.
For organizations with a direct salesforce, the Market Waterfall provides an opportunity to evaluate performance against expectations, assess CRM utilization for visibility, analyze sales coverage, expertise, and alignment with market opportunities. In these discussions, it is crucial to involve both Sales and Marketing teams to foster collaboration and alignment.
Demo available on YouTube: https://youtu.be/MSDdvVlQi4E
Use this waterfall tool to evaluate the waterfall chain for one single segment or multiple ones.

Explore tools related to the topics covered in this section. For a wider selection, visit our webshop using the link below, or continue browsing our marketing mix pages for additional insights and solutions.