Description
Why Use a Market Attractiveness Matrix
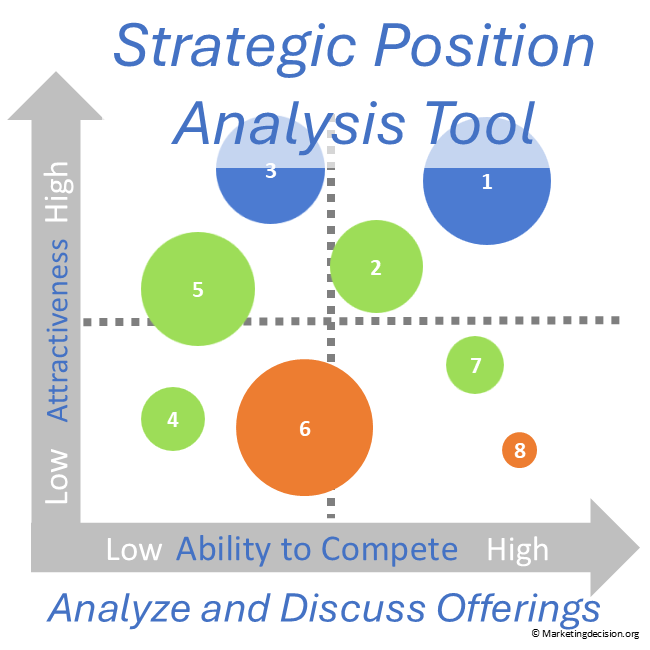
A market attractiveness matrix is a powerful tool to support portfolio analysis and strategic prioritization.
It helps organizations:
- Compare market segments or opportunities using consistent criteria
- Identify high-potential areas where the company is well positioned to win
- Highlight gaps between market potential and internal capabilities
- Support investment and resource allocation decisions
- Structure discussions around strategy, growth, and competitiveness
By making trade-offs explicit, the matrix enables more robust and aligned strategic decisions.
Prefer a quick visual overview before exploring the features?
Key Features of the Market Attractiveness Matrix Excel Tool
Strategic Portfolio Visualization
- Compare market segments, business opportunities, or solution areas
- Visualize positioning based on market attractiveness and ability to compete
- Identify priority areas using a clear two-dimensional matrix
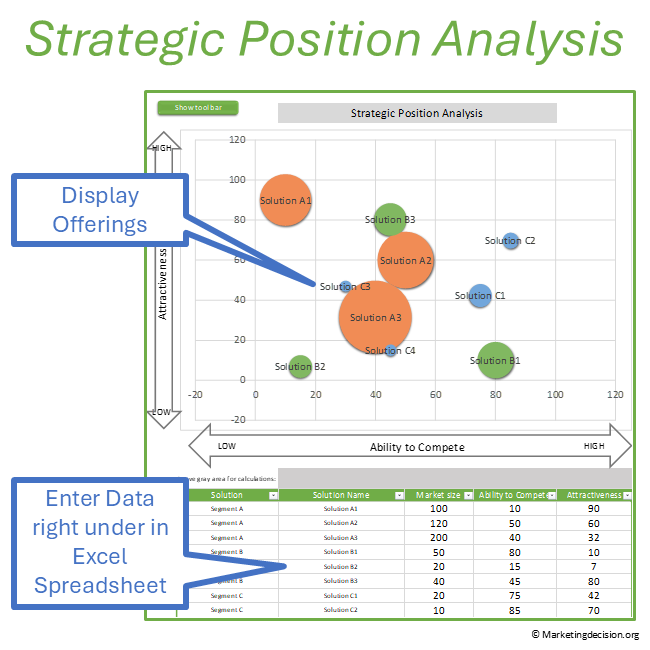
Flexible and Customizable Excel Template
- Analyze from 2 up to 100 segments or opportunities
- Adapt axes definitions to match your strategic framework
- Customize labels, criteria, and evaluation dimensions
Advanced Visual Encoding
- Use bubble size to represent market size, revenue potential, or ROI
- Apply color coding to distinguish categories, time horizons, or business units
- Enhance clarity for strategic presentations and decision-making workshops
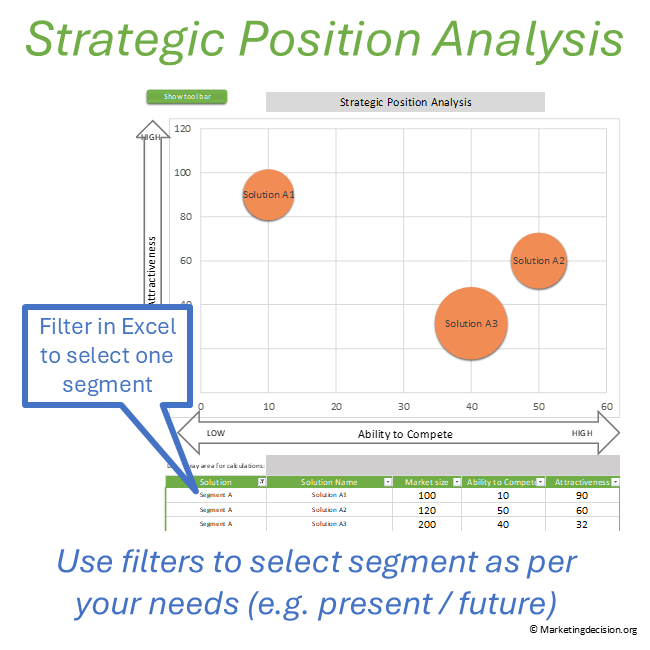
Filtering and Scenario Analysis
- Filter segments dynamically using Excel capabilities
- Focus on specific markets, business units, or strategic scenarios
Support scenario-based discussions and portfolio reviews
How to Use the Market Attractiveness Matrix
Use the tool in three structured steps:
- List your market segments, opportunities, or solution areas
- Evaluate each based on market attractiveness and ability to compete
- Visualize the matrix to compare, prioritize, and guide strategic decisions
This approach transforms complex strategic assessments into a clear and actionable portfolio view.
Adapting the Matrix to Your Strategic Framework
The matrix is fully adaptable to different strategic contexts.
While the standard structure uses:
- Market attractiveness (external perspective)
- Ability to compete (internal capabilities)
You can redefine axes to reflect:
- Industry attractiveness
- Competitive positioning
- Strategic fit or capability strength
This flexibility makes the tool suitable for corporate strategy, business unit planning, and portfolio management.
Use Cases
This market attractiveness matrix Excel tool can be used for:
- Market and segment prioritization
- Portfolio and business unit analysis
- Strategic investment decisions
- Growth opportunity assessment
- Competitive positioning analysis
Advanced Features of the Market Attractiveness Matrix Excel Tool
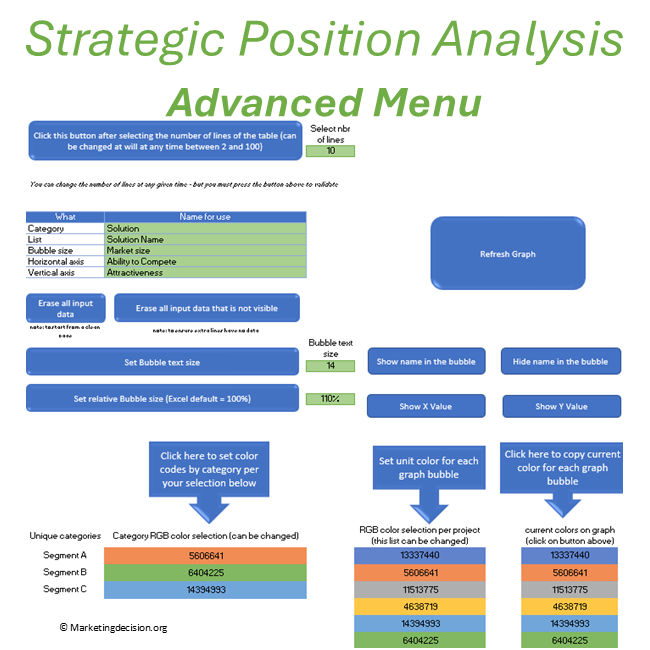
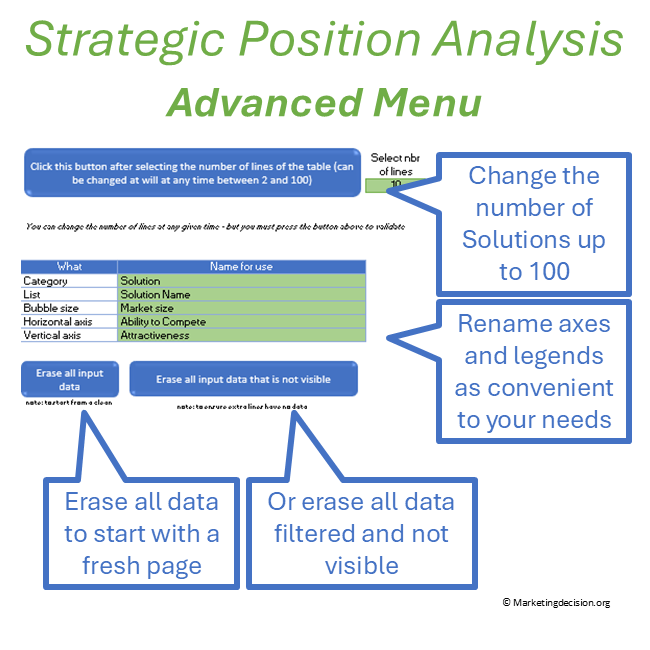
Select the green button “Show Toolbar” to display the advanced features panel on the left (click again to hide it).
These functionalities enhance the flexibility of the tool and support deeper strategic and portfolio analysis.
Data Selection and Management
- Select the number of entries (2 to 100 segments or opportunities)
- Erase all input data to reset the matrix
- Erase non-visible data for filtered analysis
- Update axis names and legends to match your strategic framework
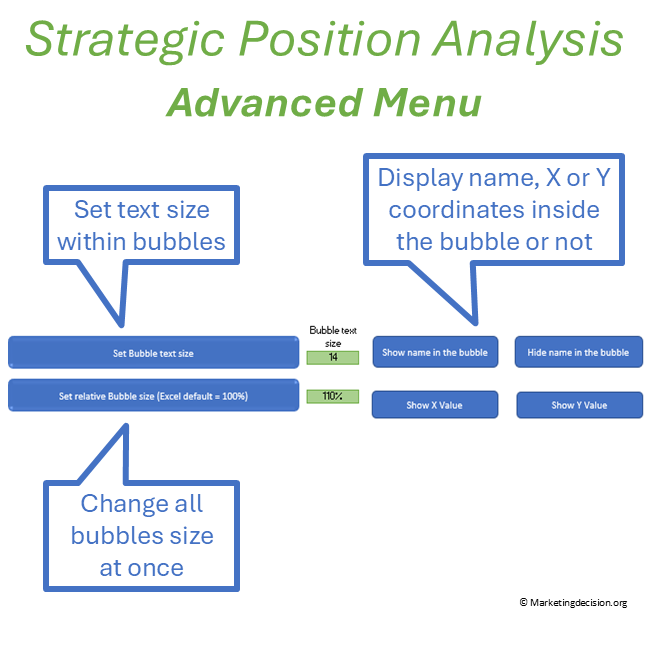
Legend and Display Capabilities
- Show or hide names on graph bubbles
- Display or hide labels directly on the matrix
- Adjust bubble text size for improved readability
- Set relative bubble size (Excel default = 100%)
- Display axis values directly on bubbles
These options allow you to tailor the matrix for analysis, workshops, or executive presentations.
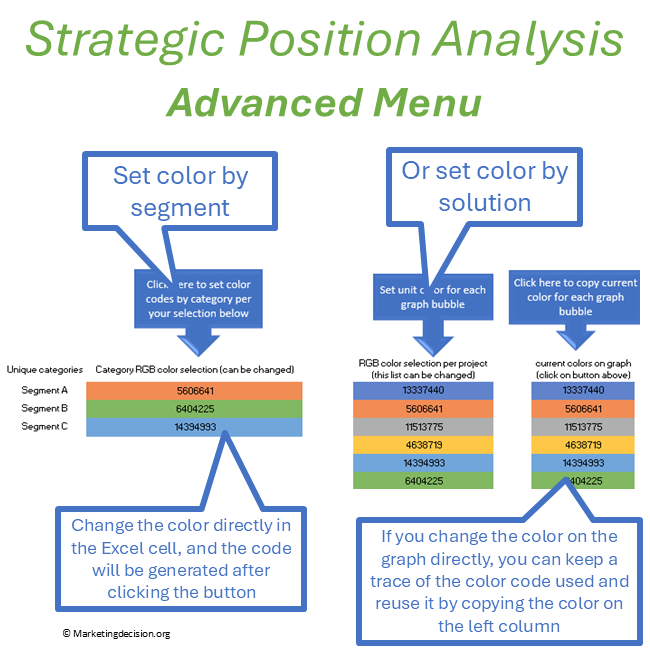
Color Customization and Visual Control
- Assign colors based on categories or segments
- Set individual colors for each element
- Automatically store color codes in the Excel table
Advanced capability:
- Copy colors directly from the graph and reuse them
- Ensure consistent visual communication across analyses
Full Flexibility with Excel Macros
You have full access to the macros embedded in the file, allowing you to:
- Adapt the tool to your specific needs
- Extend or customize functionalities
- Develop additional features if required
👉 This makes the tool a flexible and scalable strategic analysis solution, not just a static template.
Links and References
This market attractiveness matrix Excel tool builds on structured approaches described in our Solution Mix framework, which helps define value drivers, differentiation logic, and strategic positioning.
👉 It can be used in combination with other tools to support end-to-end strategic analysis and decision-making.
In Summary
The Market Attractiveness Matrix Excel Tool provides a structured way to evaluate market segments and strategic opportunities based on external potential and internal capabilities. By combining market attractiveness and ability to compete, it supports clearer prioritization, better alignment, and more effective investment decisions.
Usage & Licensing
This product is intended for professional use only. Please review the Sales Conditions to fully understand your rights and usage limitations.
Licensed for a single business unit (up to 100 employees)
Additional licenses required beyond this scope
Download link valid for 2 months
Up to 10 downloads allowed
Users have full access to the application, including embedded macros, and may adapt it to their needs. However, all branding, trademarks, and references must remain visible and unchanged.
Ensure that you have Microsoft Excel and a PC running Windows before purchasing this application. This application uses advanced dynamic range calculations introduced by Microsoft. Please ensure that you are using a compatible version of Excel, such as Microsoft 365, or any version released after Excel 2019 which supports this feature.
We appreciate your feedback on how to improve this application. Feel free to share your suggestions with us at contact@marketingdecision.org