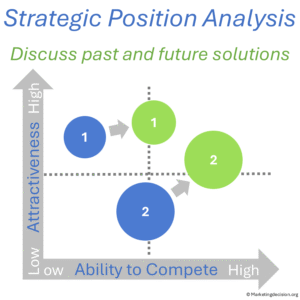
The Strategic Position Analysis Tool is an effective approach to analyze and discuss both current and future offerings in comparison to the market.
Many solutions may be conceived, but which ones are better positioned to succeed in the marketplace? And which will truly enhance competitiveness? This is the purpose of the Strategic Position Analysis tool.
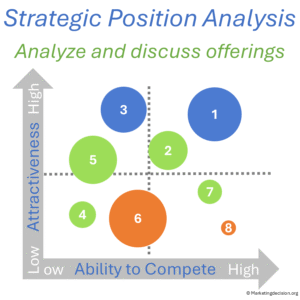
Current or future solutions can be mapped along two axes: “ability to win” (or ability to compete) and “market attractiveness.”
By visualizing these dimensions, teams can compare solutions for their market fit and competitive strength, discuss how well they align with company objectives, and decide where limited investment budgets should be directed.
In addition, a variation of this tool focuses on markets rather than solutions, offering another powerful way to determine which markets to target—and why.
A marketing strategy aims to identify the market hot spots that offer the most promising growth opportunities. When evaluating current or future offerings, three key dimensions help guide marketing decisions:
 Market segment potential
This reflects the relative size of a segment compared to others and highlights where greater business impact can be achieved.
Derived from several factors—such as relative growth, technology maturity, profitability, or brand alignment—market attractiveness helps identify where to compete and why certain segments are more promising than others.
This measures the capacity to differentiate from competitors. Even the most advanced solution may struggle to succeed if it faces a strong rival. A company’s ability to stand out and defend its position must therefore be carefully considered.
These three dimensions form a strategic map with two main axes: market attractiveness (vertical) and ability to win (horizontal).
The bubble size on the map represents the market potential addressed by each solution.
The Strategic Position Analysis map offers four quadrants that represent distinct competitive situations.
 High ability to win / High market attractiveness: These solutions are strategic priorities—develop and protect them.
By analyzing these positions, teams can align product roadmaps, anticipate risks, and strengthen the resilience of their development strategy.
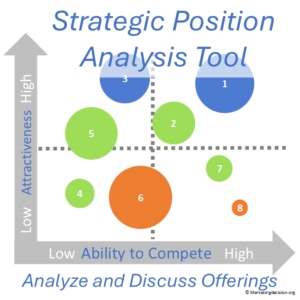 The Excel-based Strategic Position Analysis Tool simplifies these comparisons by providing a visual method to assess, discuss, and prioritize projects.
This practical visualization tool supports informed discussions and helps prioritize actions that align with your company’s strategic objectives.

Explore tools related to the topics covered in this section. For a wider selection, visit our webshop using the link below, or continue browsing our marketing mix pages for additional insights and solutions.