Description
From Analysis to Action
The Market Waterfall Tool operationalizes the Market Waterfall Analysis by translating concepts into a structured Excel model. It allows teams to move from qualitative discussions to quantitative analysis, making it easier to identify gaps, prioritize actions, and monitor performance over time.
To understand the underlying framework, see our Market Waterfall Analysis page.
Key Features of the Market Waterfall Tool
Dynamic Excel Slicers for Market Data
- Analyze the market with dynamic Excel slicers for dates and segments
- Filter data to focus on specific market segments or time periods
Market Waterfall Analysis
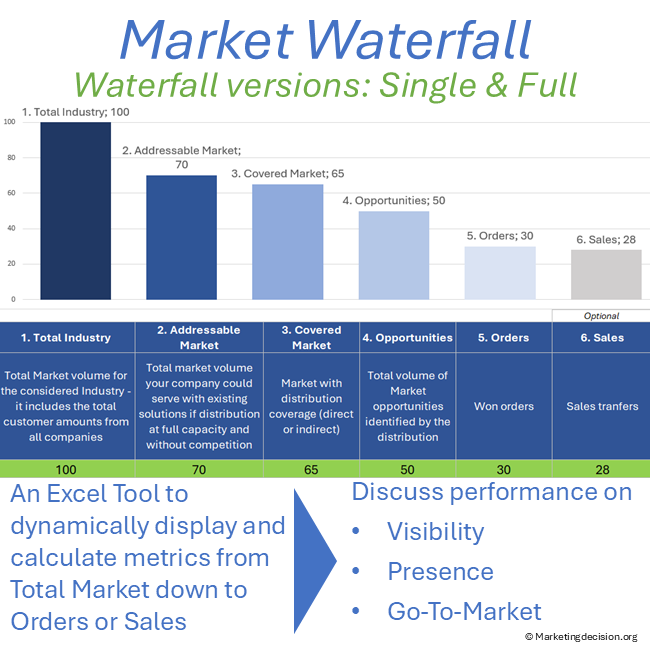
- Map volumes from total market (TAM) to opportunities, orders, and sales
- Visualize market size, coverage, and sales funnel performance through customizable graphs
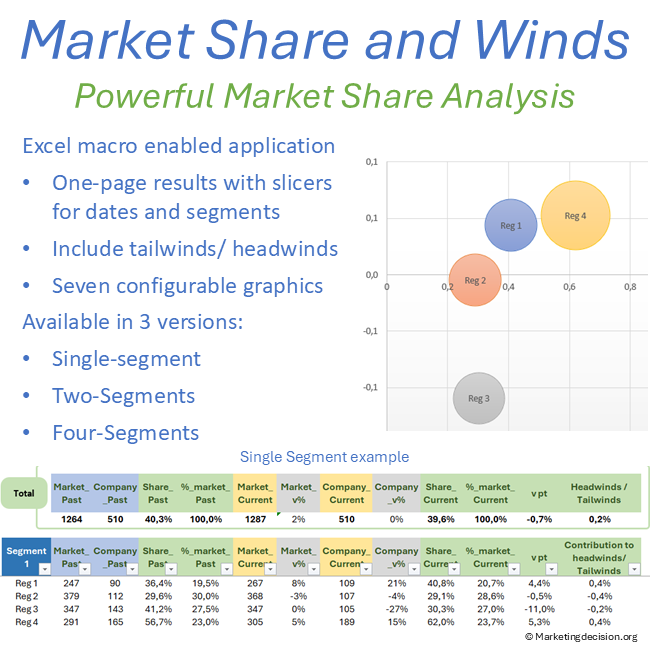
Go-to-Market Visibility and Coverage
- Compare market share and performance across segments
- Support structured market penetration analysis and strategic decision-making
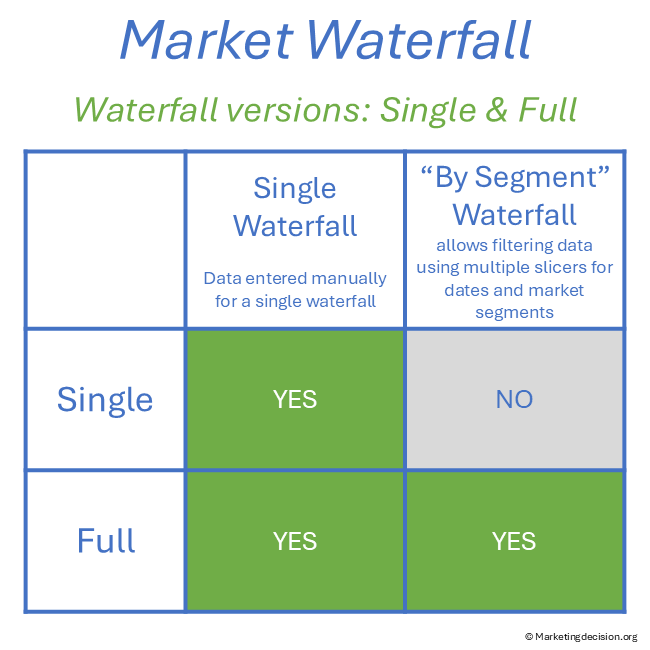
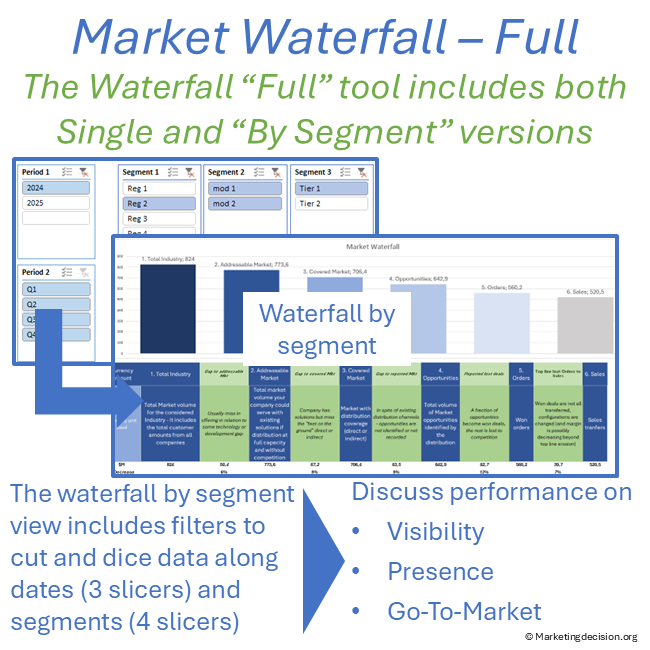
Multiple Versions for Flexibility
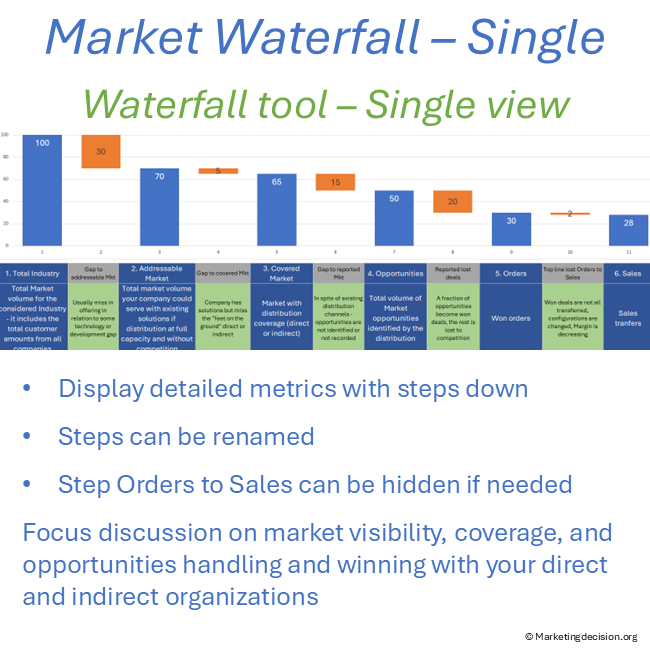
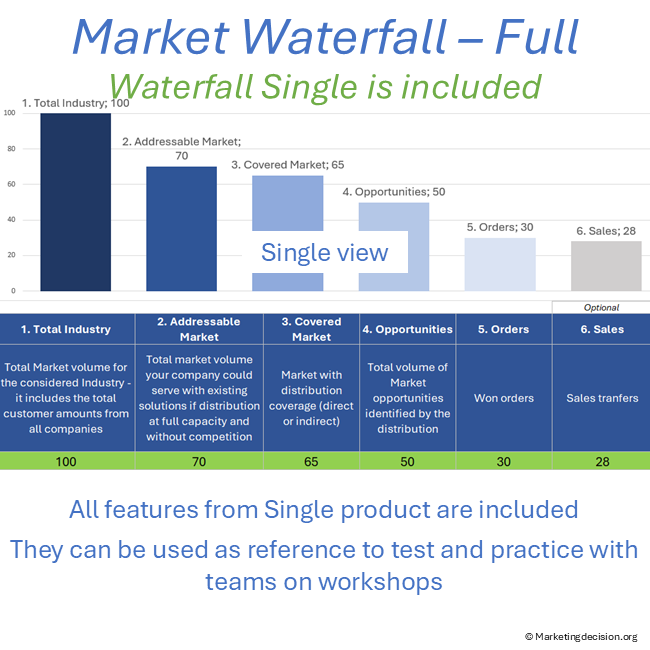
- Single Waterfall Version: Analyze one segment with a clear view of the market-to-sales progression
- Waterfall by Segment Version: Compare multiple segments and time periods using advanced filtering
How to Use the Tool
- Enter your data in the dedicated input tab
- Select segments and time periods using slicers
- Analyze the progression from market size to sales
- Visualize results to identify gaps in visibility, coverage, and conversion
Use Cases
Market Size and Sales Funnel Analysis
Analyze how your total market translates into opportunities and sales. Identify gaps in market visibility, sales coverage, and conversion performance.
Go-to-Market Performance Discussion
Compare performance across segments and align Marketing and Sales teams around data-driven insights and improvement priorities.
The Proposed Excel Tool Exists in Two Versions
Single Waterfall
Used to analyze a single market segment from total market to orders or sales. Data is entered directly and results are updated instantly.
Waterfall by Segment
Allows filtering across multiple market segments and time periods. This version supports deeper analysis and comparison, helping establish structured and repeatable performance reviews.
Common Structure of the Market Waterfall
Each version allows the display of the following steps:
- Total Market
- Addressable Market
- Covered Market
- Opportunities
- Orders
- Sales (optional – the column can be hidden if not required)
Advanced Features
Flexible Definitions
- Rename steps depending on your business model
- Merge steps such as orders and sales for flow-based activities
Graphical Visualization
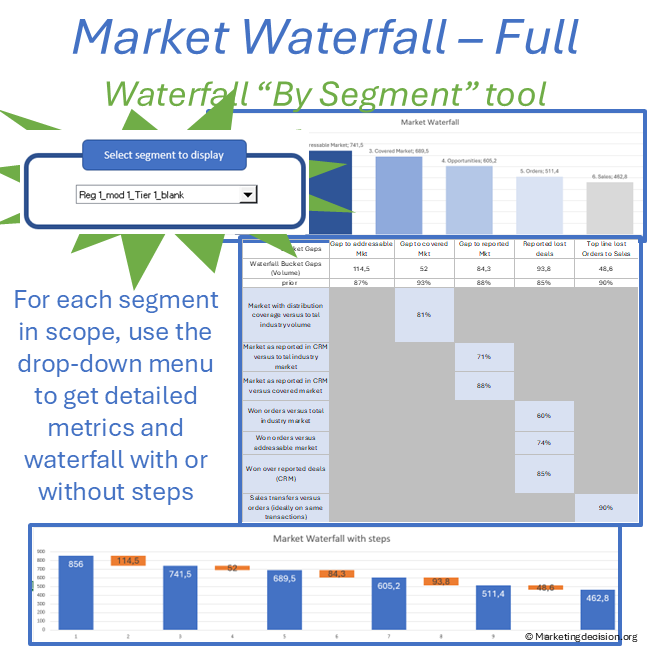
- Built-in waterfall charts provide a clear visual representation of step-by-step performance
- Supports precise gap analysis and structured discussions
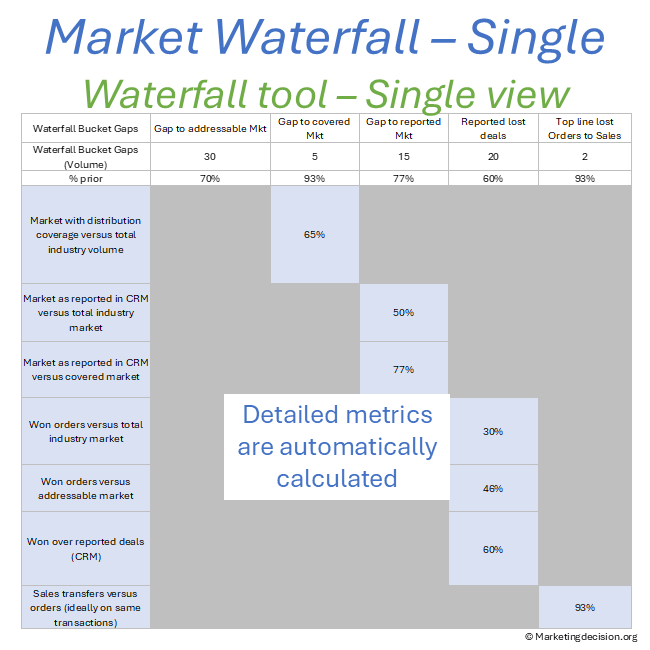
Multiple Metrics Automatically Calculated
- Coverage (%)
- Visibility (%)
- Market Share
- Win/Loss Ratio
- Converted Top Line
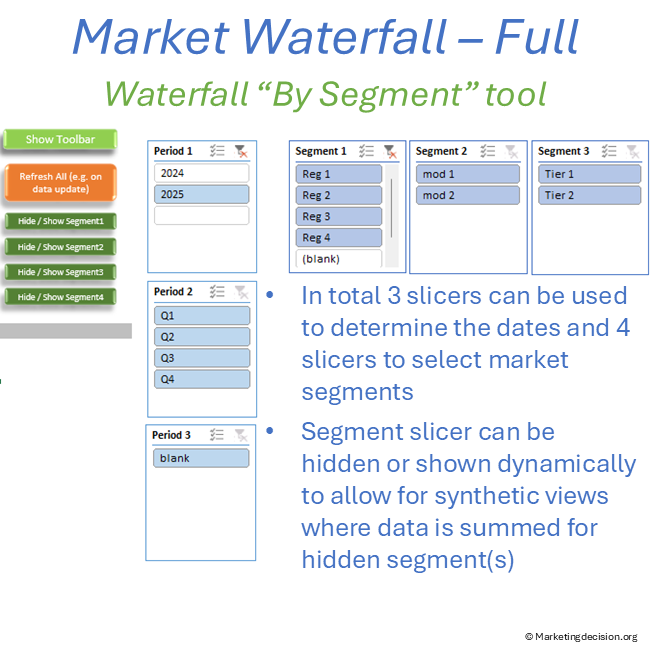
The “Show Toolbar” menu grants access to comments useful for tool customization
Single Waterfall Version – Data Entry and Structure
- Data entered directly below the graph
- Automatic calculation of results
Waterfall by Segment – Advanced Analysis (Full Version)
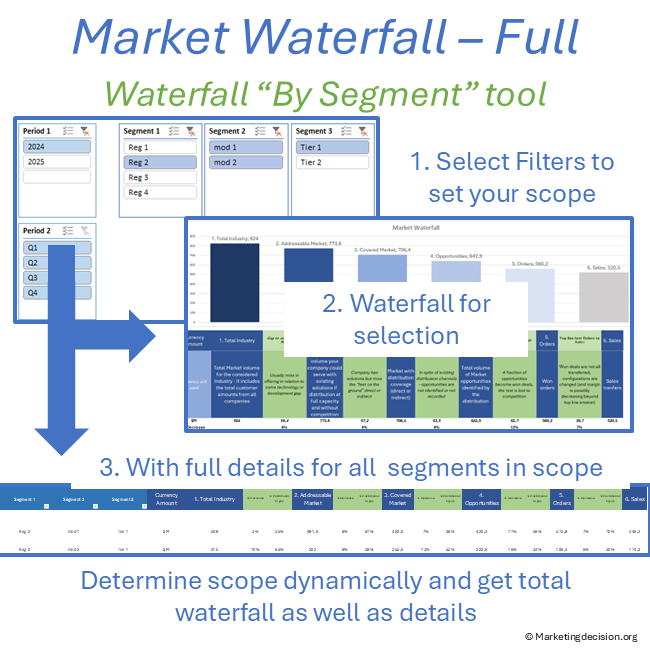
The Waterfall by Segment feature allows you to analyze how market size, coverage, and sales performance evolve across multiple dimensions such as regions, product lines, or market tiers.
A key strength of this functionality is the ability to combine detailed analysis with high-level aggregation. Using Excel slicers, you can explore specific segments or consolidate data dynamically to obtain a global view of performance.
Data Entry and Structure
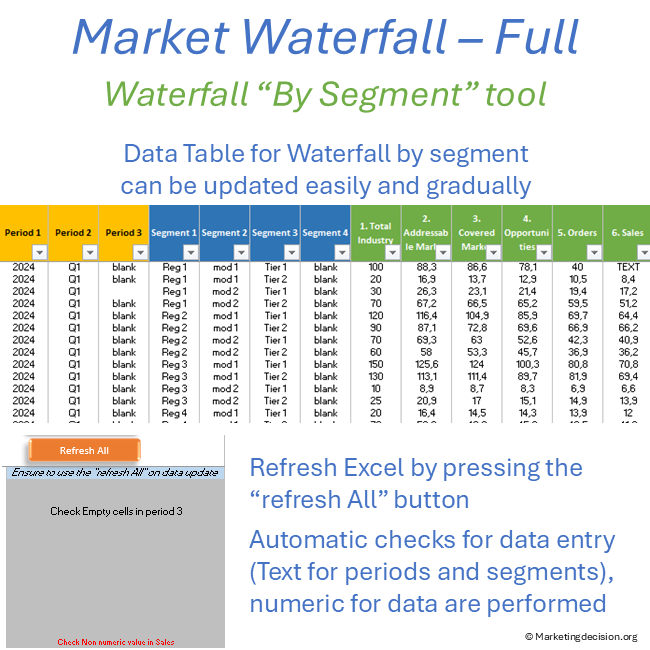
The Waterfall by Segment is populated via the dedicated tab “2.1. Data by Segment.”
- Supports multiple criteria, including time periods and market segments
- Designed for high granularity data entry to maximize analytical flexibility
- Includes:
- 3 slicers for time periods
- 4 slicers for market segmentation
To ensure data consistency, built-in checks validate numeric inputs and highlight any issues.
Pre-Populated Example and Customization
The tool includes pre-filled example data to illustrate how segmentation can be structured:
- Periods: Year, Quarter, and optional monthly view
- Segments: Regions, modalities (P&L), market tiers, or custom dimensions
All slicers and structures can be adapted to match your organization’s data and segmentation logic.
Segment Analysis and Contribution
Data is consolidated using a pivot table, enabling dynamic aggregation across selected segments and time periods.
You can:
- View the total market waterfall across all selected dimensions
- Display individual segment contributions using the “Select Segment to Display” option
This allows for a clear understanding of how each segment contributes to overall performance.
Flexible Aggregation with Slicers
A key capability of the tool is the ability to hide or display slicers dynamically, enabling different levels of analysis:
- When slicers are active → detailed segment analysis
- When slicers are hidden → data is automatically aggregated
For example, you can:
- Combine multiple product lines or market tiers
- Focus on a single dimension such as regions
- Move seamlessly between granular analysis and consolidated views
This flexibility supports both operational reviews and strategic decision-making.
Using Slicers for Multi-Dimensional Analysis
- Select one or multiple segments using slicers (CTRL + click)
- Combine time periods and segmentation dimensions
- Refresh data dynamically after updates
After updating data, simply click “Refresh All” to recalculate results.
Related Frameworks and Concepts
The Market Waterfall Analysis is most effective when connected to broader marketing frameworks:
- Market Mix → to anchor market structure
- Solution Mix → to connect with solution design and pricing
- Place Mix Strategy → to align with go-to-market execution
Usage & Licensing
This product is intended for professional use only. Please review the Sales Conditions to fully understand your rights and usage limitations.
Licensed for a single business unit (up to 100 employees)
Additional licenses required beyond this scope
Download link valid for 2 months
Up to 10 downloads allowed
Users have full access to the application, including embedded macros, and may adapt it to their needs. However, all branding, trademarks, and references must remain visible and unchanged.
Ensure that you have Microsoft Excel and a PC running Windows before purchasing this application. This application uses advanced dynamic range calculations introduced by Microsoft. Please ensure that you are using a compatible version of Excel, such as Microsoft 365, or any version released after Excel 2019 which supports this feature.
We appreciate your feedback on how to improve this application. Feel free to share your suggestions with us at contact@marketingdecision.org