
Market share analysis helps companies understand how their performance evolves relative to the market and across different segments. The Market Share Analysis Tool is an Excel model designed to help teams analyze segments, identify tailwinds and headwinds, and understand the drivers behind market share changes and growth dynamics.
A clear and deep understanding of the market environment and evolving trends provides invaluable insight into business activities and competitive dynamics. By examining how markets grow or decline across segments, companies can identify growth opportunities, evaluate competitive positioning, and support strategic investment decisions.
The proposed Excel model with macros facilitates market trend analysis and comparative assessments by keeping all market and company data in a single Excel file. Teams can easily select scope, drill down into data, and display results through graphs, including tailwinds and headwinds calculations for any segment configuration.
Learn more about tailwinds and headwinds.
Designed for professional use, this product is available in three versions, varying based on the number of segment slicers available:
To view images, click the magnifying glass icon in the top right corner of the image, or browse through the image carousel below.
© marketingdecision.org
€35.00 – €117.00Price range: €35.00 through €117.00 Exc. VAT



Market share analysis helps companies understand how their performance compares with the overall market and with competitors. By measuring the proportion of total market volume captured by a company, teams can assess whether growth results from stronger competitive positioning or from broader market dynamics.
However, market share alone does not always explain performance. Markets evolve continuously: some segments grow rapidly while others stagnate or decline. These structural changes create tailwinds and headwinds that influence overall market share development.
Analyzing these dynamics allows organizations to better understand where growth originates, which segments drive performance, and how market evolution affects strategic positioning.
Market share is often used as a simple indicator of competitive strength. Yet this indicator can sometimes hide important structural effects.
A company may gain market share simply because the segments where it is strongest are expanding faster than others. Conversely, a company can execute well and still lose share if it operates in segments that are shrinking.
Analyzing tailwinds and headwinds helps distinguish these situations. By comparing market growth across segments with company positioning, teams can determine whether performance is driven by competitive strength or by favorable market structure.
These insights are particularly valuable when evaluating investment priorities, portfolio choices, and long-term market opportunities.
Prefer a quick visual overview before exploring the features?
Analyze the market by date (year, quarter, month) and by segments using Excel slicers.
Filter data dynamically to focus on specific market segments or time periods.
Calculate tailwinds and headwinds for any segment configuration.
Understand the impact of market growth or decline on your market share.
Visualize market share trends and growth drivers with customizable graphs.
Compare market share across segments to identify opportunities and risks.
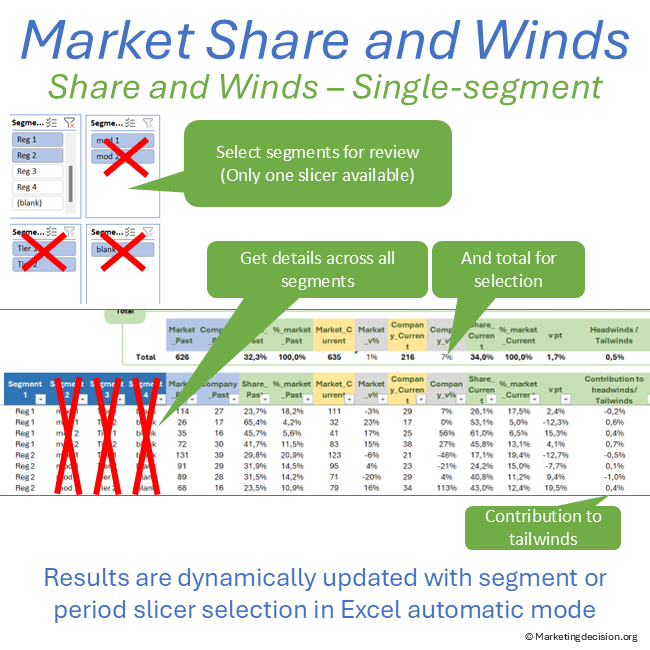
Single-Segment Version: Filter data along a single axis.
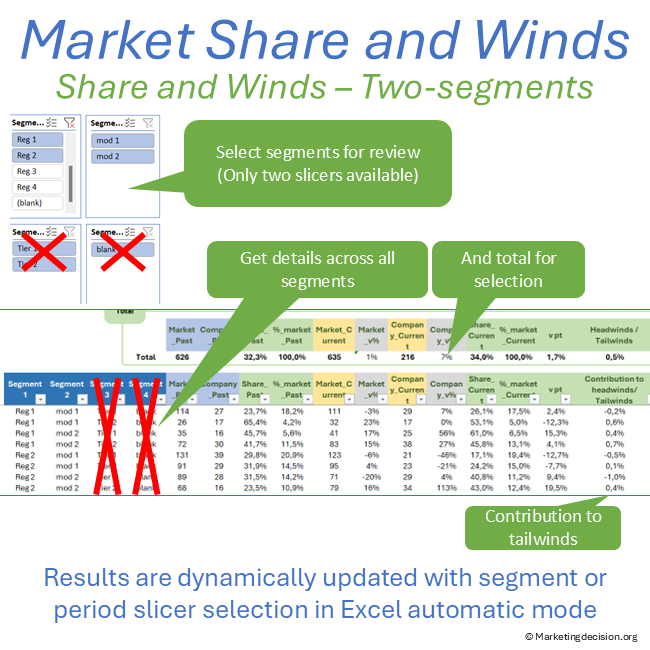
Two-Segments Version: Select segments across two dimensions (for example regions and P&L).
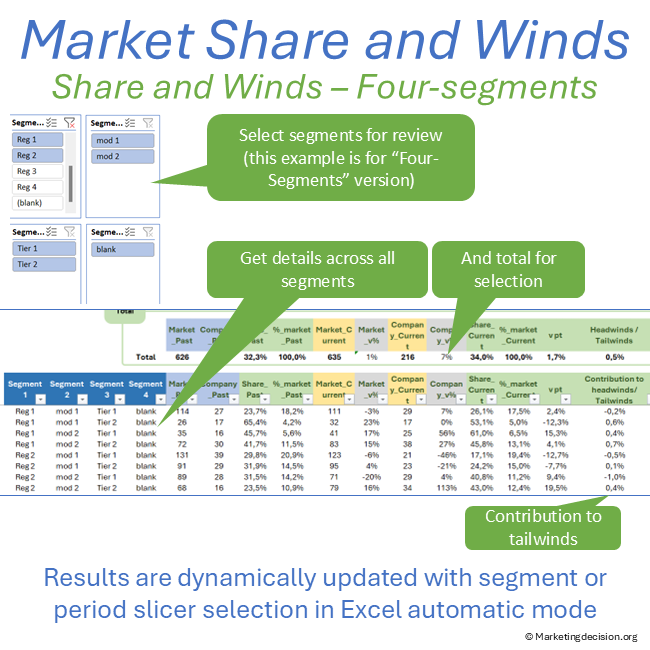
Four-Segments Version: Analyze data across four dimensions (for example region, countries, P&L, sub-modalities).
Enter Your Data
Use the dedicated data entry tab to input market and company data.
Select Segments and Dates
Use Excel slicers to filter data by segments and time periods.
Analyze Tailwinds and Headwinds
Review the calculated tailwinds and headwinds for each segment.
Visualize Results
Use the graphs to visualize market share trends and growth drivers.
Market Share Growth Analysis
Analyze market share trends to identify growth opportunities and risks.
Use tailwinds and headwinds calculations to understand market dynamics.
Segment-Level Insights
Compare market share across different segments to identify strengths and weaknesses.
Use the tool to guide investment decisions and strategic planning.
Data Selection
Select the number of lines for the table between 2 and 100.
Erase all input data or only non-visible data as needed.
Update names for axes and table legends.
Graph Customization
Show or hide names on graph bubbles.
Adjust bubble text size and relative bubble size.
Display horizontal and vertical axis values on graph bubbles.
Color Schemes
Set colors for bubbles by category or individually.
Copy and save bubble color codes for consistency.
Metrics Display
For the selection of dates and segments, the table is created dynamically by simply changing slicer selections (or pressing F9 if the tool is set to manual calculations).
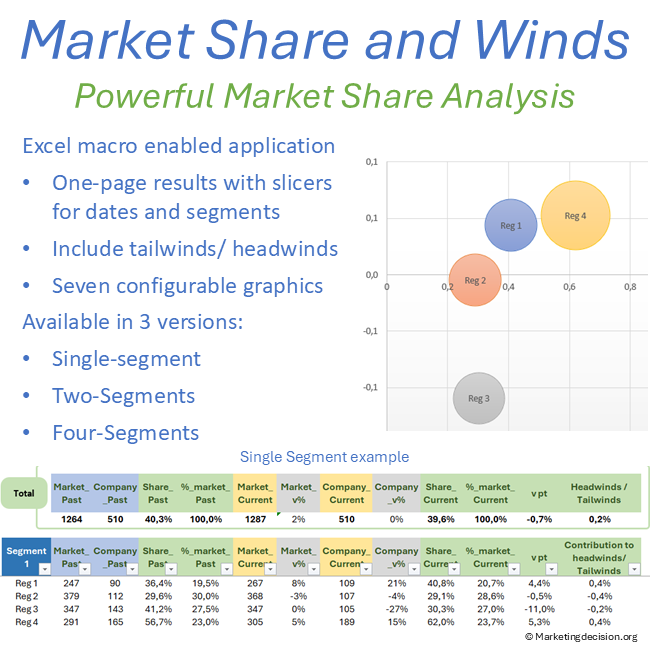
For each segment and the two selected time periods, the following metrics are displayed:
The total for selected segments is displayed above the table. The table can accommodate up to 510 lines of segment metrics, summing all displayed segments and calculating total tailwinds and headwinds.
When rows are filtered, totals automatically adjust and graphs display only visible lines from the first 19 rows of results.
This metric represents the market share gain or loss resulting from market growth or decline across segments.
Positive value: indicates tailwinds supporting total market share growth.
Negative value: indicates headwinds due to market mix effects negatively impacting total market share gain.
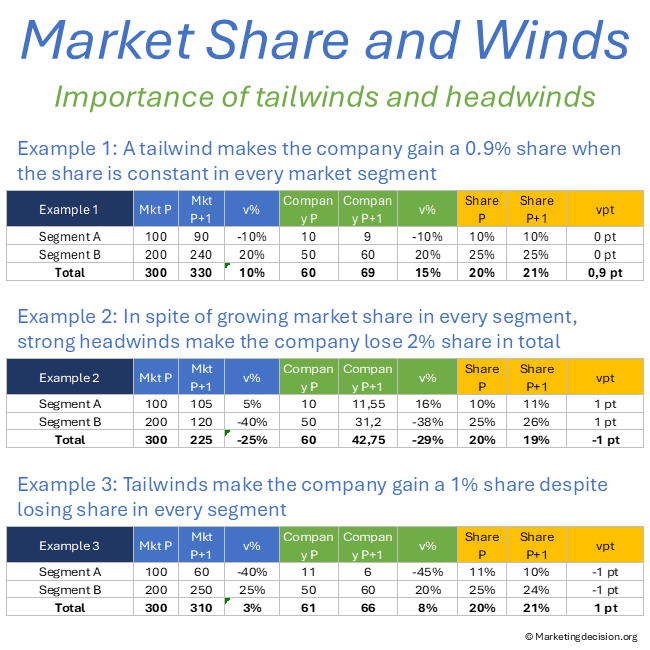
Tailwinds and headwinds are calculated by determining what the total market share would be if the company maintained the same share in each segment as in the past period while market volumes change to their current levels.
This approach reveals whether a company is positioned more strongly in faster-growing segments or in segments experiencing slower growth or decline.
Seven graphs are available, each configurable to display different metrics.
One graph is located on the Results tab, while six additional graphs are located in a dedicated Graphs tab.
The graphs use two-axis XY bubble charts, providing flexibility for visual analysis.
Users can dynamically select:
Buttons allow toggling information such as names, axis values, and bubble values.
These graphs support different storytelling perspectives, for example:
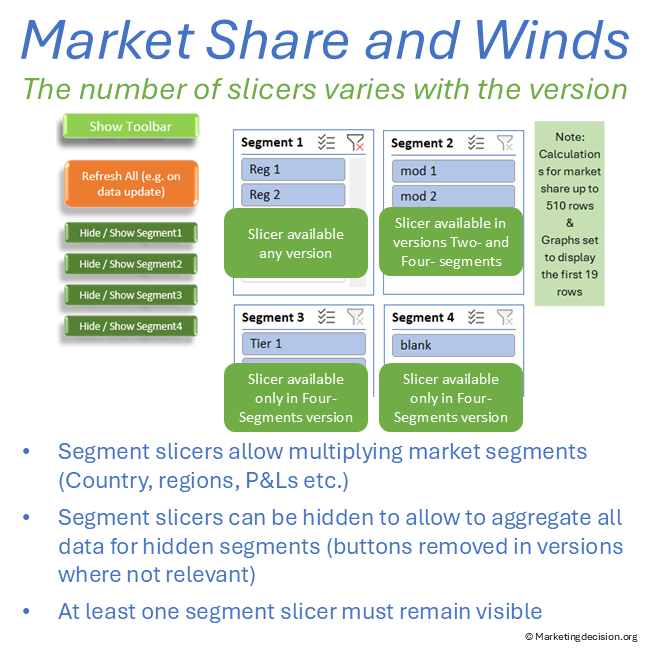
Two periods can be selected to compare data. Each period is defined using three slicers, allowing flexible definitions such as year, quarter, or month.
Additional slicers enable the selection of market segments.
The three versions of the tool differ only by segmentation capabilities:
Single-Segment Version: One slicer selecting all segments defined in the dataset.
Two-Segments Version: Two slicers allowing combinations such as region and product line.
Four-Segments Version: Four slicers enabling hierarchical segmentation such as region, country, P&L, and modality.
In multi-segment versions, slicers can be hidden except for one, allowing aggregation of all underlying segments.
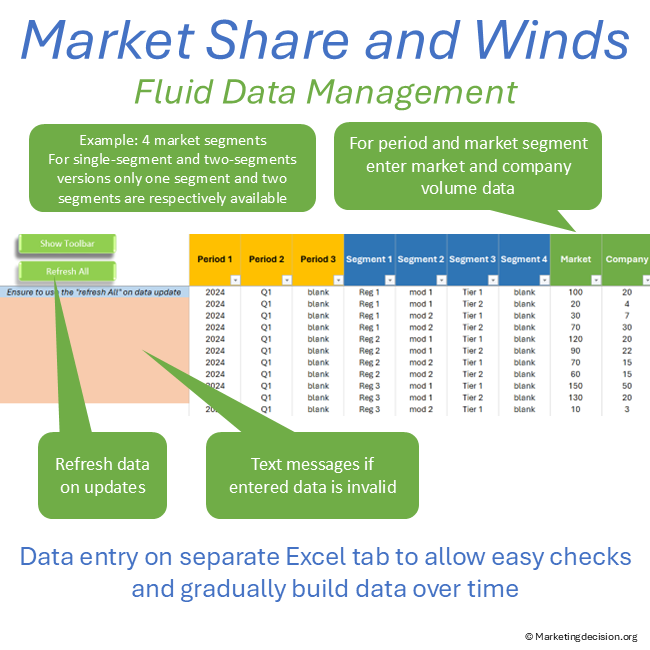
Data is entered through a dedicated tab to prevent accidental modification while exploring results and graphs.
Data can be progressively added over time, and results refresh automatically using the Refresh All button.
Dates are entered using three slicers (year, quarter, month). Multiple fields may be used within a slicer, allowing different period definitions.
Market and company fields must contain numeric values representing market volume. Market share is calculated as the ratio of company volume over market volume.
If descriptions are missing or non-numeric values are entered, an error message prompts correction.
For users who wish to display both orders and sales data in the same file, one segment slicer may be used to separate orders from sales. However, comparing orders and sales is often better addressed using waterfall analysis.
Comparing competitors on the same graph is generally not recommended because data quality for one’s own company is typically much more accurate than for competitors. When competitor analysis is needed, a segment slicer can be used to select competitors individually.
Maintaining separate versions of the file for competitor analysis and internal segmentation analysis is often advisable.
The mathematical demonstration of tailwinds and headwinds can be understood by introducing an intermediary scenario where market volumes correspond to the current period while segment shares remain identical to those of the past period.
Tailwinds and headwinds analysis depends on a clear understanding of market structure and segmentation. See the Market Mix framework for the foundation behind these dynamics.
Understanding where growth and decline occur across segments also helps guide solution investment and portfolio decisions. To place these insights in context, refer to the Solution Mix page.
Purchase and use of the application are subject to the applicable General Sales Conditions.
General Sales Conditions — English
Conditions Générales de Vente — Français

We use cookies to improve your experience on our site. By using our site, you consent to cookies.
Manage your cookie preferences below:
Essential cookies enable basic functions and are necessary for the proper function of the website.
These cookies are needed for adding comments on this website.
Stripe is a payment processing platform that enables businesses to accept online payments securely and efficiently.
Service URL: stripe.com (opens in a new window)
Statistics cookies collect information anonymously. This information helps us understand how visitors use our website.
Google Analytics is a powerful tool that tracks and analyzes website traffic for informed marketing decisions.
Service URL: policies.google.com (opens in a new window)