Description
What is a Qualitative Forecasting Tool?
A qualitative forecasting tool supports decision-making by helping teams identify, evaluate, and structure potential future events that may influence the market.
Rather than relying solely on historical datasets, this approach enables organizations to:
- Capture weak signals and emerging trends
- Assess strategic risks and opportunities early
- Structure expert discussions across teams
- Build a shared understanding of possible future scenarios
Qualitative forecasting does not replace quantitative forecasting. Both approaches are complementary and should be used together.
While quantitative forecasting provides measurable projections based on historical data, qualitative analysis enables teams to:
- Map events that are not yet quantifiable
- Challenge assumptions behind data-driven models
- Assess the reliability and robustness of forecasts
In practice, qualitative forecasting plays a critical role in strengthening the interpretation and credibility of quantitative results.
When to Use Qualitative Forecasting (vs Quantitative Methods)
Qualitative forecasting is essential when data is incomplete, uncertain, or not yet available.
Typical use cases include:
- New markets or product launches
- Technological disruptions or regulatory changes
- Strategic planning under uncertainty
- Early-stage opportunity or risk identification
In contrast, quantitative methods require stable historical data. When such data is missing, qualitative approaches provide a more relevant and actionable framework.
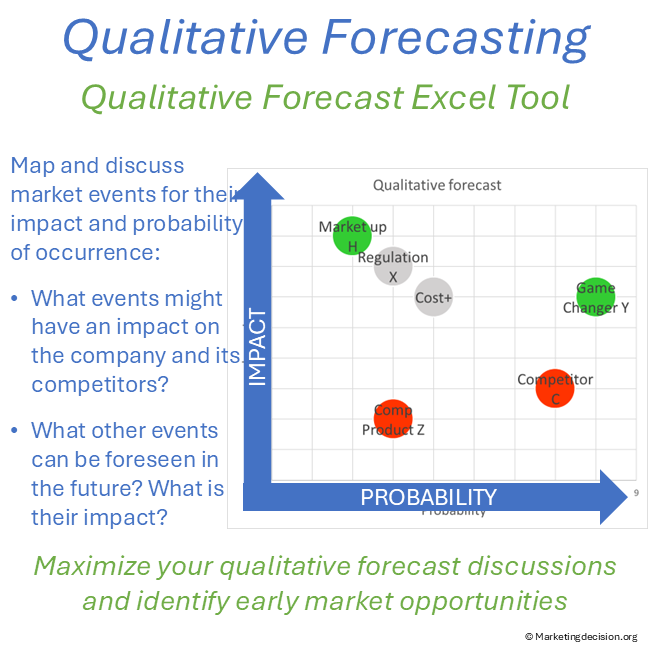
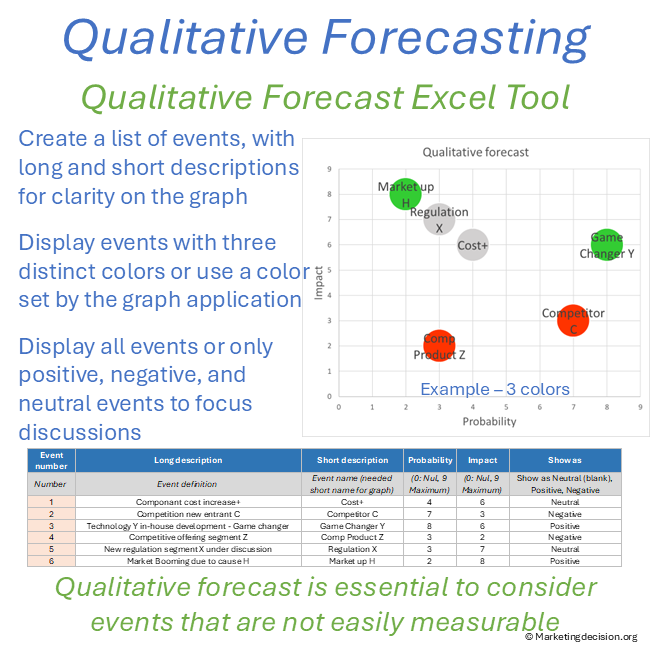
Forecast Market Events Using Impact and Probability
This Excel tool enables teams to map market events on a two-dimensional matrix, combining:
- Probability of occurrence
- Impact on the business or market environment
Events positioned in the top-right quadrant (high impact, high probability) naturally become priorities for discussion and decision-making.
This structured visualization helps teams:
- Focus on what truly matters
- Challenge assumptions collectively
- Align perspectives across functions
Why Use a Qualitative Forecasting Tool for Market Analysis
A qualitative approach is not only about listing events—it is about creating clarity and alignment in uncertain environments.
This tool helps teams:
- Anticipate market changes before they materialize
- Strengthen strategic discussions and decision-making
- Identify both risks and opportunities within the same framework
- Build more resilient and adaptable action plans
The real value lies in structuring conversations and anchoring insights into a shared visual framework.
Key Features of the Qualitative Forecasting Excel Tool
- Create and manage a structured list of market events, including short and long descriptions (up to 255 events)
- Assess each event using two key dimensions:
- Probability of occurrence
- Impact (scale from 0 to 9)
- Automatically position events on a visual matrix, highlighting priorities
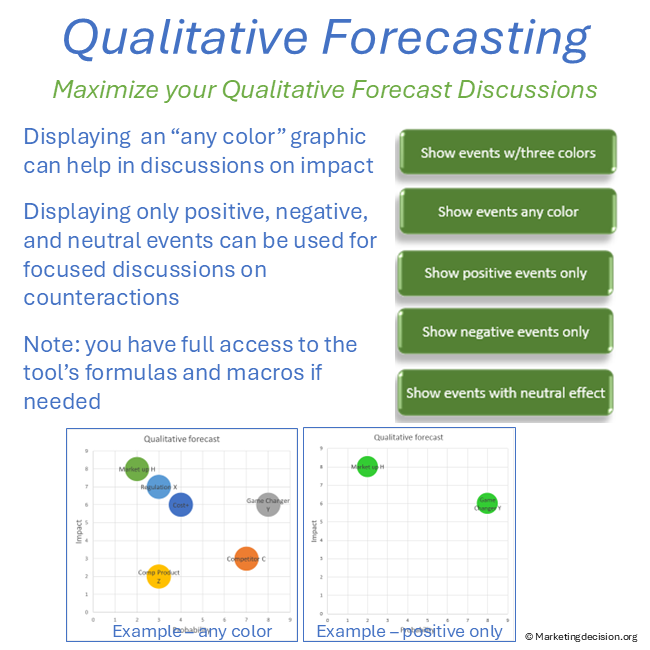
- Classify events as positive, negative, or neutral, enabling color-coded analysis
- Filter and display events dynamically:
- All events
- Only positive / negative / neutral events
- Custom color views for presentations
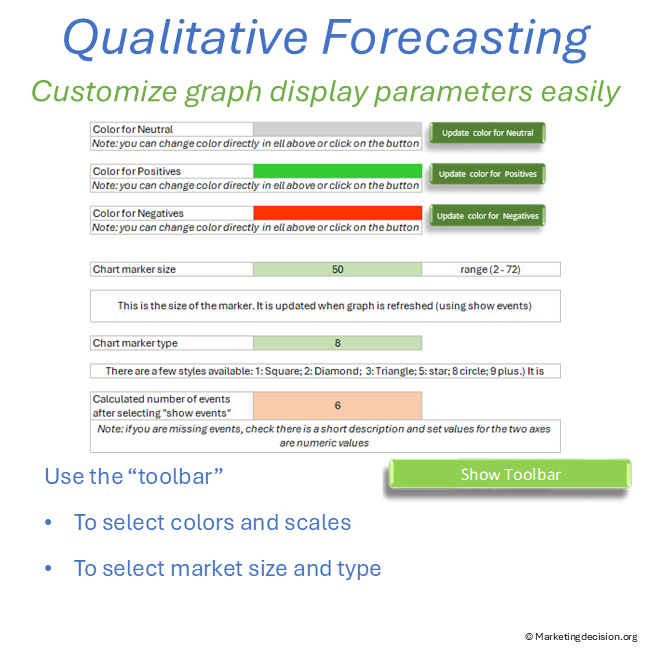
Advanced Features and Customization Options
The tool includes a customizable interface to adapt outputs to your needs:
- Define custom colors for different event types
- Select marker styles (square, diamond, triangle, star, circle, etc.)
- Adjust marker size for optimal readability in presentations
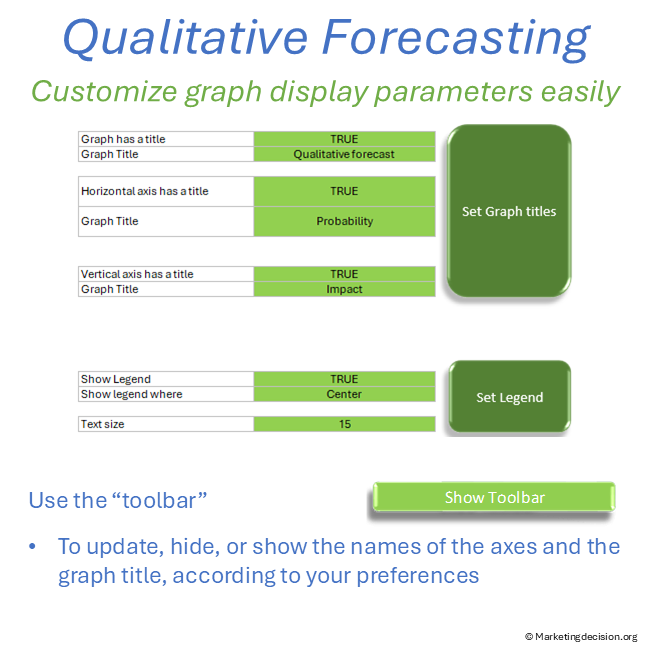
- Configure graph titles, axis labels, and legend positioning
- Show or hide the toolbar for a clean presentation view
Users also benefit from full access to embedded macros, allowing further customization if required.
How to Use the Tool in Workshops and Market Analysis
This tool is designed for flexible use across different contexts:
- Team workshops to identify and prioritize market events
- Strategy sessions to explore future scenarios
- Market analysis reviews to consolidate insights from multiple frameworks
- Cross-functional discussions to align perspectives
It is particularly effective when used alongside tools such as:
- PESTLE analysis
- Porter’s Five Forces
- Market segmentation frameworks
👉 The tool acts as a consolidation layer, transforming dispersed insights into a clear and actionable view.
From Market Events to Strategic Decisions
Forecasting is not about predicting the future with certainty—it is about preparing for it.
By structuring how events are identified, assessed, and discussed, this tool enables organizations to:
- Move from observation to anticipation
- Prioritize actions based on impact and likelihood
- Strengthen strategic positioning in uncertain environments
This is where qualitative forecasting becomes a competitive advantage.
Links and References
Event impact and probability need a clear structural market view. See Market Mix for the context guiding these assessments.
Usage & Licensing
This product is intended for professional use only. Please review the Sales Conditions to fully understand your rights and usage limitations.
Licensed for a single business unit (up to 100 employees)
Additional licenses required beyond this scope
Download link valid for 2 months
Up to 10 downloads allowed
Users have full access to the application, including embedded macros, and may adapt it to their needs. However, all branding, trademarks, and references must remain visible and unchanged.
Ensure that you have Microsoft Excel and a PC running Windows before purchasing this application. This application uses advanced dynamic range calculations introduced by Microsoft. Please ensure that you are using a compatible version of Excel, such as Microsoft 365, or any version released after Excel 2019 which supports this feature.
We appreciate your feedback on how to improve this application. Feel free to share your suggestions with us at contact@marketingdecision.org