Market Forecasting Excel Tool – Quantitative Multi-Metric Model

Use the evidence you already have to build a market forecast you can understand, discuss and defend.

Compare multiple market indicators, external forecasts and internal data in Excel. Analyze them across up to four independent market dimensions – such as region, country, technology or business unit – and automatically aggregate the data when a dimension is not required. Visualize annual growth trajectories, identify where sources converge or diverge, and build a weighted market assumption for planning and decision-making.

© marketingdecision.org

€69.00 Exc. VAT

SKU MT-MQF-01 Category

Build a Market Forecast from Multiple Sources

market - forecast - quantitativeForecasting market growth rarely depends on a single source.

Economic indicators, industry estimates, external forecasts and internal data may each provide a different perspective on how a market could develop.

The challenge is not simply to collect more data. It is to compare these different signals, understand where they converge or diverge, and establish a market growth assumption that can be explained and discussed.

The Market Forecasting Excel Tool helps you bring multiple quantitative sources together, compare their evolution year by year, and build a structured market forecast.

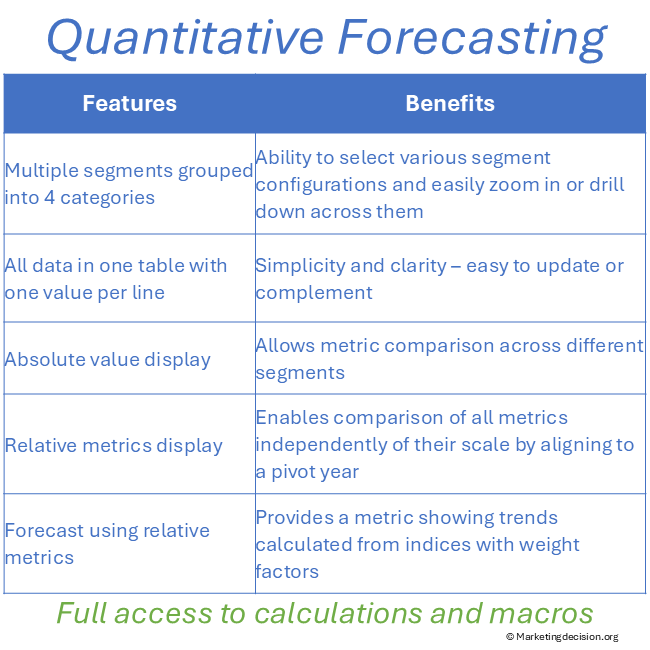
The same analysis can be explored across up to four independent market dimensions. You can focus on selected regions, countries, technologies, business units or other segments, while dimensions that are not required can be hidden and automatically aggregated. This allows the same forecasting model to support both detailed market analysis and more consolidated views.

Rather than hiding the underlying information behind a single calculated result, the tool keeps the different sources visible throughout the analysis.

This helps teams understand the evidence behind the forecast, challenge assumptions and agree on a market outlook they can use for planning and decision-making.
When Different Sources Tell Different Stories

An industry forecast may suggest strong market growth while economic indicators point toward slower development. Internal information may provide another perspective.

Which source should drive your forecast?

There is not necessarily one source that provides the answer.

The Market Forecasting Excel Tool lets you:

  • compare multiple quantitative sources side by side
  • visualize their annual growth trajectories
  • identify where trends converge or diverge
  • examine absolute values and relative growth
  • decide which metrics are most relevant to your market
  • apply different weights when appropriate
  • build a consolidated market growth assumption

Differences between sources are not simply a problem to eliminate. They can provide useful information.

Understanding why different indicators or forecasts point in different directions can help teams challenge assumptions before deciding what market development they are prepared to use in their plans.

From Market Data to a Discussable Forecast

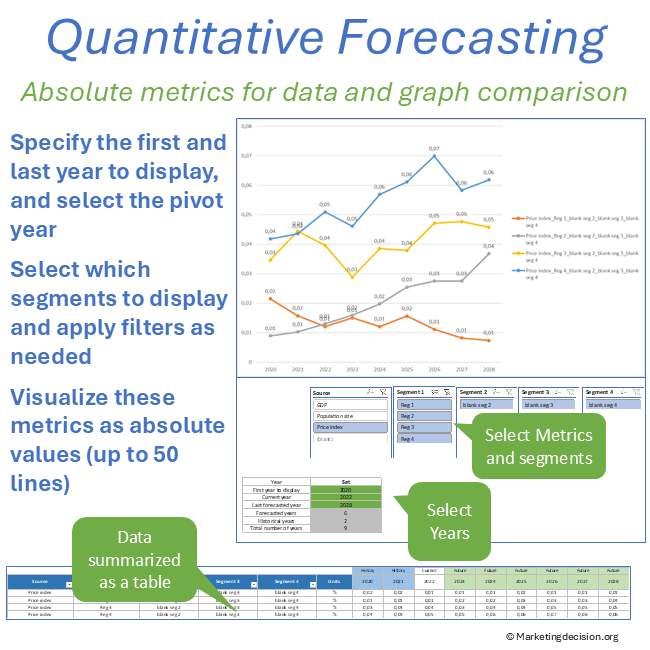
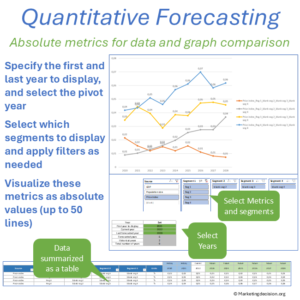
Absolute annual market metrics compared by year and segment in Excel

The tool provides two complementary ways to examine quantitative market information.

Absolute Analysis – Understand the Original Data

Absolute analysis keeps the original values and units visible.

This is useful when you want to examine the actual values behind a forecast or compare datasets expressed in compatible units.

It allows you to review the underlying information before deciding how it should contribute to the forecast.

Relative Analysis – Compare Different Growth Trajectories

Market indicators often use completely different units.

GDP may be expressed in currency, an industry index in points, market demand in units, and another indicator as a percentage.

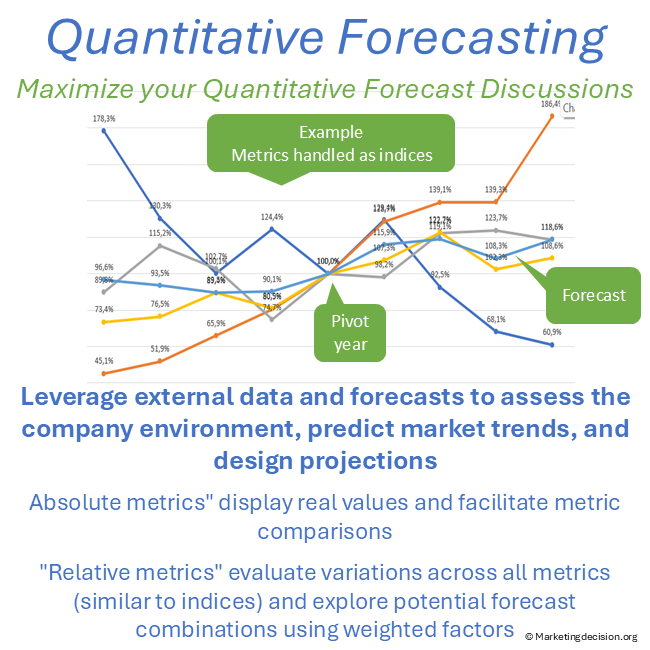
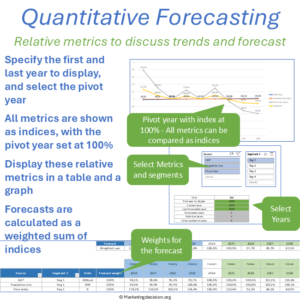
Relative analysis aligns these different metrics around a common reference year. Each annual data series can then be compared from the same starting point, making different growth trajectories visible even when their original values cannot be compared directly.

The objective is not to pretend that different metrics measure the same thing. It is to make their year-by-year growth trajectories comparable.
Build a Weighted Market Forecast

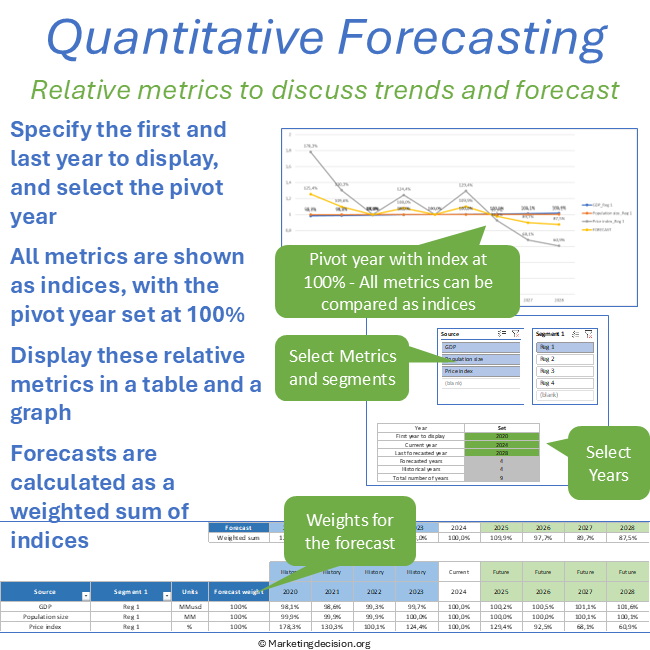
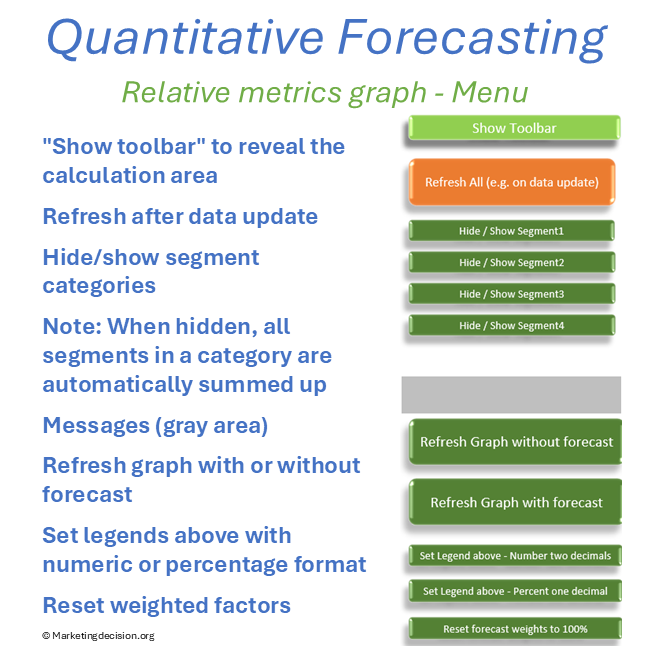
market-forecasting-excel-tool-relative-metrics-weighted-analysisOnce the different trajectories are visible, you can decide how much relevance each source should have in the final forecast.

The tool allows you to assign different weights to selected metrics. These weights are normalized to 100% and used to calculate a consolidated market forecast.

You can display the consolidated forecast together with the individual metrics or focus on the final market outlook.

This makes the reasoning behind the forecast visible.

Instead of presenting a number without context, you can show which information contributed to the assumption and how the different sources were considered.

The result is a structured market forecast that can be reviewed, challenged and adjusted as assumptions or market conditions change.

Why Use a Multi-Metric Approach?

A single market forecast or economic indicator can provide valuable information, but no individual source provides certainty about future market development.

Using several relevant sources – such as economic indicators, industry forecasts, market research estimates and internal data – provides different perspectives on market development. The objective is not to use as many metrics as possible, but to select those that help establish a reasonable and explainable market-growth assumption.

A Forecast for Discussion, Not Just Calculation

A market forecast often becomes a shared baseline for decisions involving investment, resources, product development, marketing and sales.

For that reason, the assumptions behind it matter.

A forecast that colleagues can understand and challenge can be more useful for decision-making than a number whose underlying reasoning is difficult to see.

The Market Forecasting Excel Tool keeps the individual sources, their trajectories and their relative weighting visible.

This makes the forecast easier to discuss across teams and easier to revisit when new information becomes available.

Quantitative evidence informs the forecast. It does not determine the forecast.

For a broader discussion of quantitative and qualitative forecasting approaches, see the Market Forecast methodology.

See the Quantitative Market Forecasting Tool in Action

See how multiple quantitative sources can be compared, aligned and combined into a structured annual market forecast.

How the Market Forecasting Excel Tool Works

The tool is designed for annual market forecasting.

Each metric uses one value per year, allowing different annual datasets to be compared across the same forecasting period.

It is not designed for monthly or quarterly forecasting.

The workbook then takes you through five main steps.
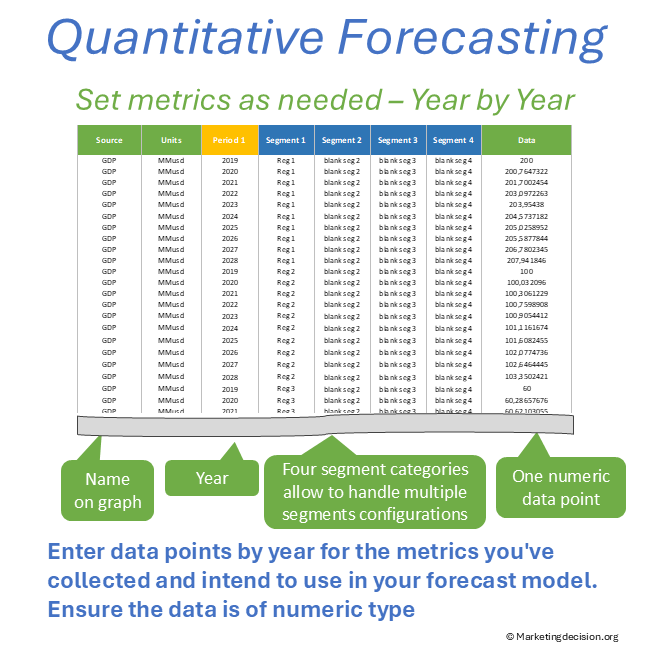
market-forecasting-excel-tool-data-structure-multi-source-modelStep 1: Enter Your Annual Market Data

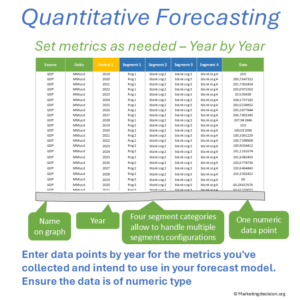
Enter the quantitative data you want to evaluate in the workbook.

Each dataset can represent a relevant market indicator, external forecast, internal metric or other quantitative source.

The tool uses annual data, with one value per year for each metric.

The different annual data series are organized across the same years so that their development can be analyzed and compared consistently.

Step 2: Review Absolute Metrics

Use the Absolute Metrics analysis to examine the original data and compare metrics expressed in compatible units.

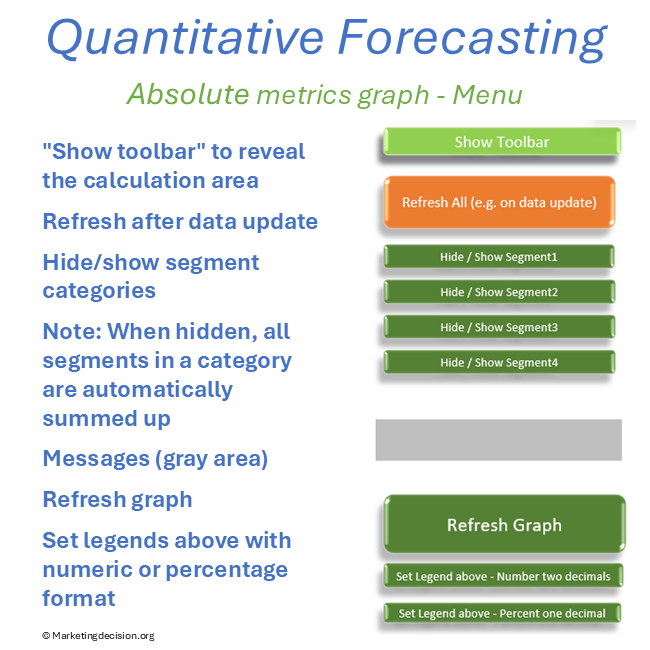
Filters and display options help you focus on the information relevant to the analysis.

This view is particularly useful for checking the underlying data before moving to relative comparisons.

Step 3: Compare Relative Market Trends

Use the Relative Metrics analysis to compare sources expressed in different units.

Select the Current year. It acts as the pivot between historical and forecast data, allowing the different annual datasets to be compared through their growth trajectories.

This makes it easier to see which indicators suggest stronger or weaker market development and where their evolution converges or diverges.

Step 4: Select and Weight Relevant Metrics

Not every source needs to contribute equally to the final forecast.

Select the metrics you consider relevant and assign an appropriate weighting to each.

The tool automatically normalizes the selected weights to 100%.

This allows you to test how different assumptions influence the consolidated market outlook while keeping the contribution of each source transparent.

Step 5: Build and Visualize the Consolidated Forecast

The weighted metrics are combined into a consolidated quantitative market forecast.

You can display the final forecast together with the underlying metrics or show the consolidated trajectory separately.

The forecast can therefore be used not only as an output, but also as a basis for discussion.

When assumptions change or new annual information becomes available, the analysis can be updated and the effect on the forecast reviewed.
When Is This Tool Useful?

The Market Forecasting Excel Tool is particularly useful when:

  • several external forecasts or market indicators are available
  • different sources suggest different market-growth trajectories
  • annual market assumptions need to be documented and explained
  • teams need to compare quantitative evidence before agreeing on a forecast
  • a business plan or strategic decision requires a defendable market-growth assumption
  • assumptions need to be reviewed as new information becomes available

It can support market analysis, strategic planning, business development, product planning and cross-functional forecasting discussions.

Because the tool works with annual data, it is particularly suited to medium- and long-term market planning rather than short-term monthly or quarterly forecasting.

Who Is It For?

The tool is designed for professionals who need to translate market information into a structured quantitative assumption, including:

  • marketing and market intelligence teams
  • business development professionals
  • product and portfolio managers
  • strategy teams
  • analysts
  • managers preparing business plans or investment assumptions

No advanced statistical modelling is required to use the tool.

The purpose is to make relevant quantitative evidence easier to compare, structure and discuss.

Quantitative and Qualitative Forecasting Work Together

Not every development that may affect a market can be captured in historical numerical data.

Changes in regulation, technology, competition, customer behaviour or other market events may influence future development before their effects can be measured quantitatively.

For this reason, quantitative forecasting can be complemented by qualitative analysis.

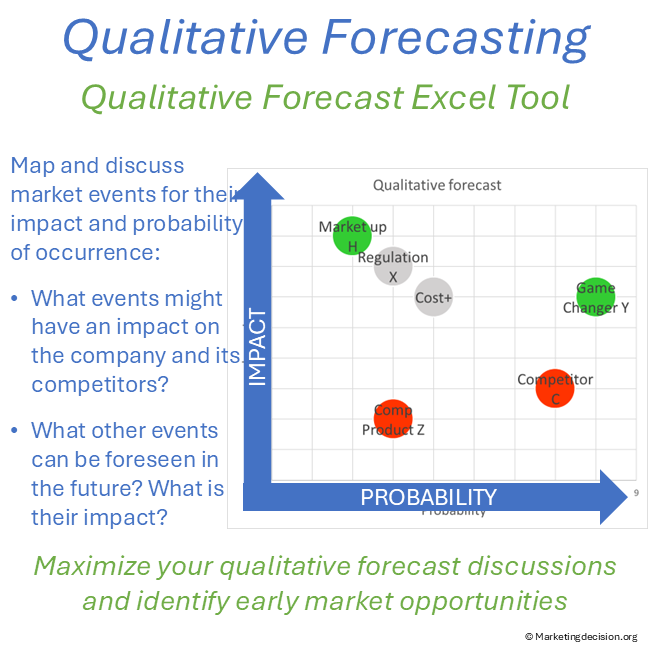
The Qualitative Forecasting Tool helps teams identify and assess future market events according to their potential impact and probability.

Together, the two approaches provide different perspectives.

Quantitative forecasting helps compare measurable market information and construct a quantitative market-growth assumption.

Qualitative forecasting helps assess events and developments that may affect the market but are difficult to quantify reliably.

Tool Features

Analysis

  • Absolute and relative market analysis
  • Comparison of multiple quantitative metrics
  • Individual and consolidated metric visualization
  • Up to four independent segment filters, which can represent dimensions such as region, country, technology or business unit
  • Select or deselect individual segments within each filter
  • Show or hide any of the four segment filters
  • When a segment dimension is hidden, data is automatically aggregated across its segments
  • Refresh Graph function to update charts when the number of data rows changes

Absolute Metrics

Displays market data in its original units.

  • Select the time range using start and end years
  • Define the Current year, which acts as the pivot between historical data and forecast data
  • Display up to 50 rows of data
  • Filter metrics by units and segments
  • Display legends as values or percentages
  • Use the four segment filters independently to focus the analysis on selected parts of the market

👉 Useful for validating data consistency and scale and for directly comparing metrics expressed in compatible units.

Relative Metrics

Displays metrics as indexed trends relative to a common pivot year.

  • Select the time range using start and end years
  • Define the Current year, which acts as the pivot between historical and forecast data and provides the reference point for the relative analysis and forecast calculation
  • Compare metrics expressed in different original units through their relative evolution
  • Identify differences in annual growth patterns
  • Select the metrics used to build the consolidated quantitative forecast
  • Display or hide the consolidated forecast
  • Adjust the weight assigned to each selected metric
  • Automatically normalize forecast weights to 100%
  • Change the Current year dynamically for relative analysis
  • Apply the same segment filters used in the absolute analysis

👉 Useful for comparing different market signals and combining selected metrics into a weighted market-growth assumption.

Data

  • Annual data – one value per year for each metric
  • Organize market data using up to four segment groups, according to the dimensions relevant to the analysis – for example region, country, technology or business unit
  • Filter individual segments independently within each group in both absolute and relative views
  • Hide any segment group when that dimension is not required
  • When a group is hidden, its segment data is automatically aggregated for each metric
  • Combine multiple market indicators and quantitative sources within the same analysis
  • Detect non-numeric values
  • Add data incrementally as the analysis develops
  • Use Refresh All after updating data to refresh the workbook calculations and analysis

👉 Decision impact: build a transparent and defendable market-growth assumption while retaining the ability to explore the underlying data from different business perspectives.

Product Requirements and License

Requirements

  • Microsoft Excel for Windows
  • Macros must be enabled for full tool functionality
  • Microsoft 365 or a current Excel version supporting the required dynamic-range functionality
  • The Excel file and its macro code are digitally signed by MARKETING DECISION SOLUTIONS SAS, allowing users to verify the origin and integrity of the downloaded tool

Download & Use

  • For professional use – see Terms and Conditions below
  • Download link valid for 2 months
  • Up to 10 downloads
  • Branding, trademarks, and references must remain visible

Terms and Conditions

Purchase and use of the application are subject to the applicable General Sales Conditions.

General Sales Conditions — English
Conditions Générales de Vente — Français