Description
Stakeholder Mapping Matrix (Excel Template)
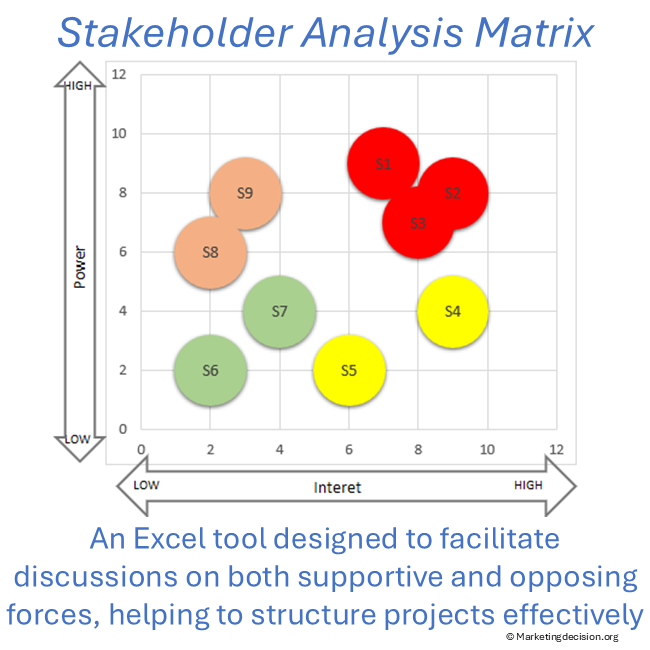
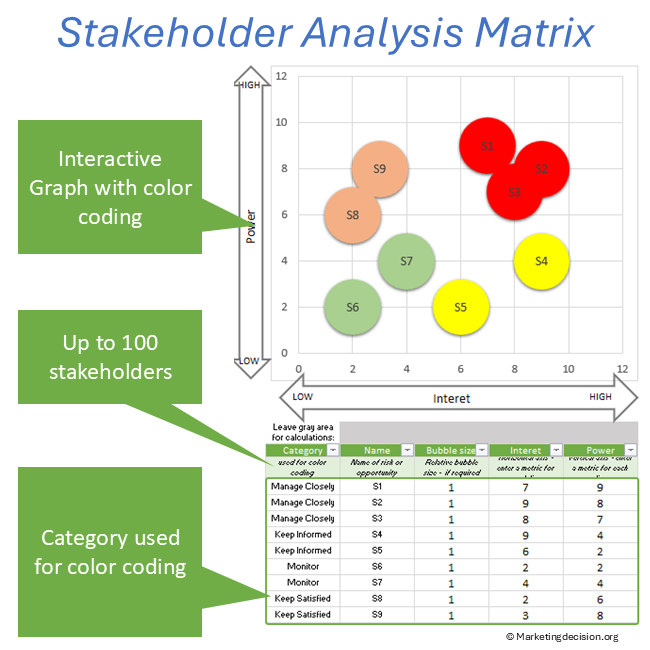
The stakeholder mapping matrix is a widely used framework to visualize stakeholders based on their power and interest. This stakeholder matrix Excel template enables teams to structure stakeholder analysis clearly, compare situations, and adapt their approach depending on project context.
By organizing stakeholders within a power interest matrix, teams can prioritize engagement, anticipate resistance, and align actions with stakeholder expectations.
Power/Interest Matrix for Stakeholder Analysis
The power/interest matrix is a core component of stakeholder analysis. By positioning stakeholders across these two dimensions, teams can better understand influence dynamics and define appropriate strategies.
This stakeholder analysis Excel template helps transform qualitative perceptions into structured inputs, making discussions more objective and actionable.
Stakeholder Analysis Context
The Stakeholder Analysis Tool is essential for evaluating the strengths and weaknesses of projects in relation to the numerous stakeholders who intervene at various stages. These stakeholders may be external to the project team or the company, including customers or their representatives.
Understanding both supportive and opposing forces in project development is crucial, as it helps structure the approach, strengthen project organization, and assess the project’s viability early on.
The proposed stakeholder mapping Excel template is based on a two-dimensional graph that captures two key dimensions: interest and power or influence. These axes help identify the relative power of each stakeholder and serve as a key tool for development teams to determine strategy, facilitate discussions, and take action.
Key Features of the Stakeholder Analysis Tool
This stakeholder mapping Excel template is a two-dimensional matrix where each individual or group is mapped onto a graph to assess their level of interest and power. It is particularly useful for identifying which stakeholders require attention early in the project.
Consider populating the tool in a way that ensures completeness, avoiding the omission of key stakeholders and enabling appropriate actions to be taken early on. One key benefit is that it encourages teams to reflect on project success factors, where communication is often critical.
The bubble size must be set to a non-null value, for example, 1 as in the example. Note that bubble size can be used, if found desirable, to represent a third dimension.
Steps to Use the Tool
- Compile a comprehensive list of stakeholders (individuals or groups) with the project team. Ensure the list is exhaustive, covering both internal and external stakeholders. Enter these into the data table (bottom right).
- Evaluate each stakeholder along the two axes (interest and power). Compare stakeholders relative to one another and map them by entering their values in the data table.
- Assess each stakeholder’s attitude, influence, and power, then determine the necessary actions.
This stakeholder analysis Excel template is designed to facilitate discussions and reveal potential challenges, enabling teams to take proactive measures for project success.
Advanced Features
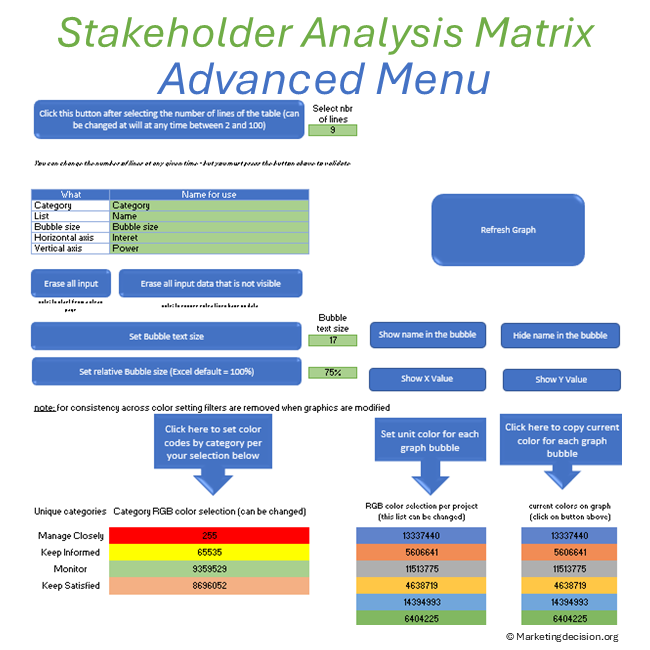
Select the green button “Show Toolbar” to display the advanced features on the left in the “Toolbar” (click again to hide the toolbar):
Data Selection
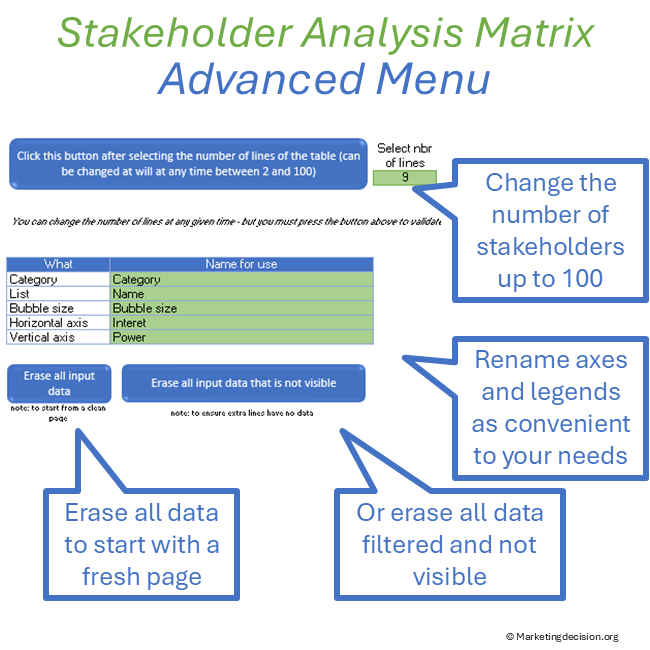
- Select the number of lines for the table between 2 and 100.
- Erase all input data: This button erases all data in the table.
- Erase all input data that is not visible: Click this button to erase data from the table that is not visible. This can take a few tens of seconds.
- Names for axes and table legends can be updated.
Legends Capabilities
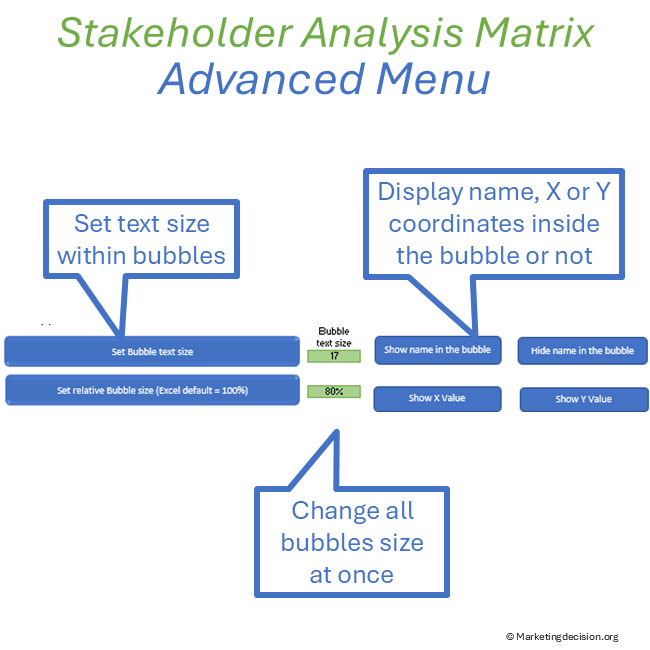
- Show names on the graph bubbles.
- Hide names on the graph.
- Set bubble text size: Click this button once the bubble text size value is updated.
- Set relative bubble size (Excel default = 100%): Click this button once the relative bubble size is updated.
- Show horizontal axis value on the graph bubbles.
- Show vertical axis value on the graph bubbles.
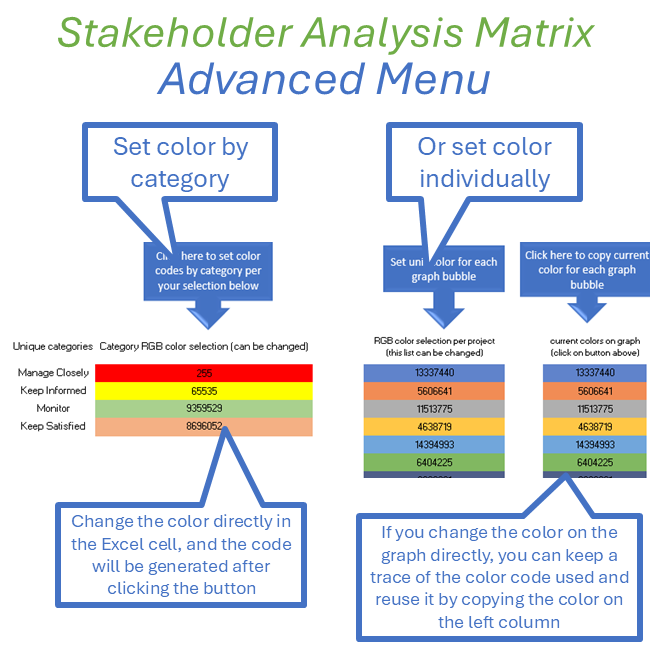
Changing Color Schemes
- Setting color for bubbles as a function of category
- Setting color for each graph bubble
- Copying current bubble color code
Note: You have full access to the macros of this file, so you can adapt or create new macros.
Links and References
Stakeholder tools are more effective when guided by clear objectives. See the Decision Mix framework for stakeholder analysis and decision alignment.
Usage & Licensing
This product is intended for professional use only. Please review the Sales Conditions to fully understand your rights and usage limitations.
Licensed for a single business unit (up to 100 employees)
Additional licenses required beyond this scope
Download link valid for 2 months
Up to 10 downloads allowed
Users have full access to the application, including embedded macros, and may adapt it to their needs. However, all branding, trademarks, and references must remain visible and unchanged.
Ensure that you have Microsoft Excel and a PC running Windows before purchasing this application. This application uses advanced dynamic range calculations introduced by Microsoft. Please ensure that you are using a compatible version of Excel, such as Microsoft 365, or any version released after Excel 2019 which supports this feature.
We appreciate your feedback on how to improve this application. Feel free to share your suggestions with us at contact@marketingdecision.org