
Description
Why Use a Weighted Decision Scorecard in Excel?
Decision-making often involves balancing multiple criteria, perspectives, and uncertainties. A structured scorecard helps:
- Clarify evaluation criteria and priorities
- Align stakeholders around a shared framework
- Compare solutions consistently
- Support transparent and well-justified decisions
Using an Excel-based template makes the approach easy to apply, adapt, and share across teams.
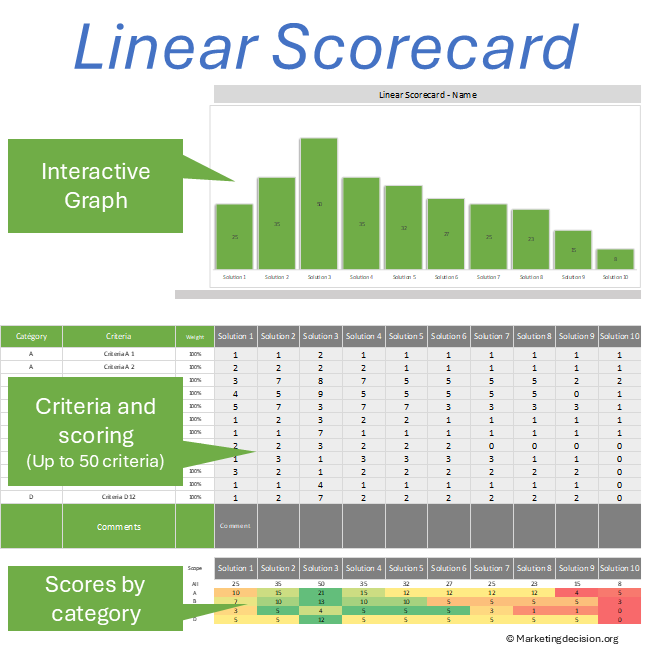
Key Features of the Excel Scorecard Template
Weighted Criteria Evaluation
- Compare up to 10 solutions using weighted criteria
- Combine qualitative and quantitative evaluation
- Assign weights to reflect strategic priorities
Structured Solution Comparison
- Evaluate projects, vendors, or service offerings
- Use category-based scoring to structure discussions
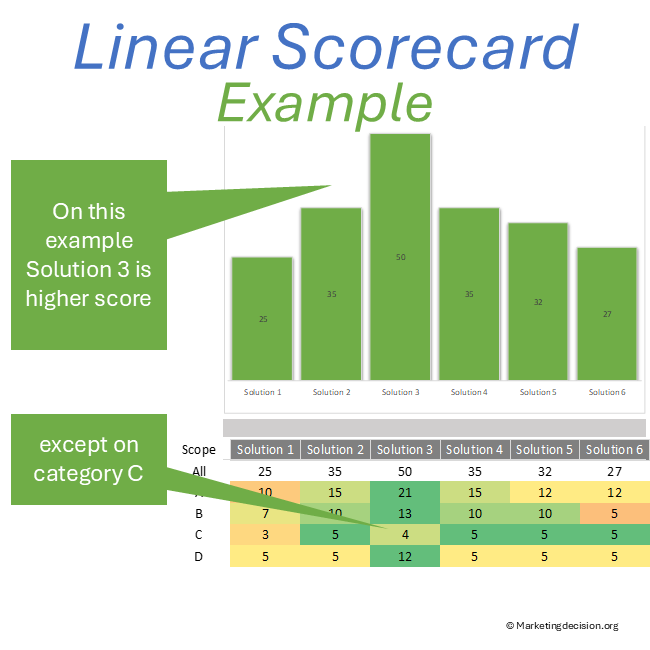
- Visualize total scores and category performance
Flexible and Scalable Framework
- From 10 to 50 criteria can be defined
- Criteria can be grouped into categories
- Adaptable across industries and decision contexts
Typical Applications of a Decision Scorecard
A weighted decision scorecard can be used in many professional situations:
- Vendor selection (CRM, suppliers, agencies)
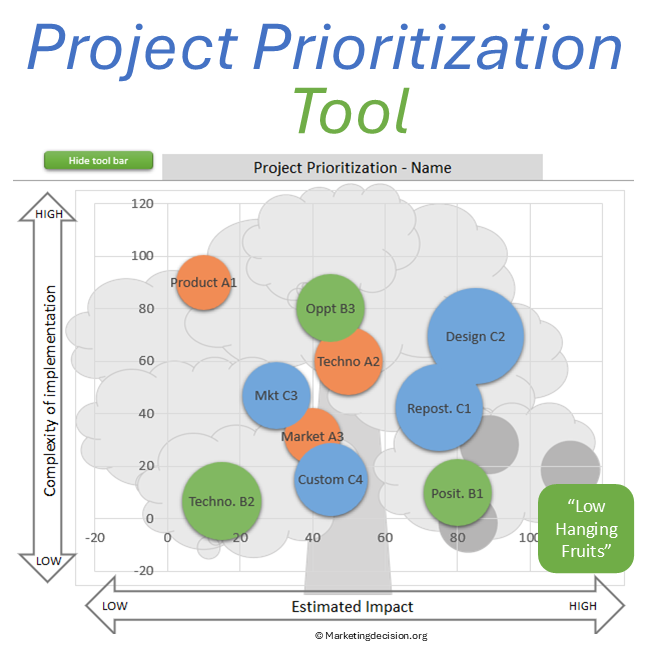
- Project prioritization and investment decisions
- Solution comparison in B2B environments
- Strategic planning and portfolio evaluation
Weighted Decision Scorecard vs Decision Matrix vs Weighted Sum Model
These terms are often used interchangeably but reflect different perspectives:
- Decision Matrix: a general framework for comparing options
- Weighted Decision Scorecard: a practical implementation using weighted criteria
- Weighted Sum Model (Linear Model): the mathematical foundation
The linear scorecard presented here applies this model in a structured and practical Excel format.
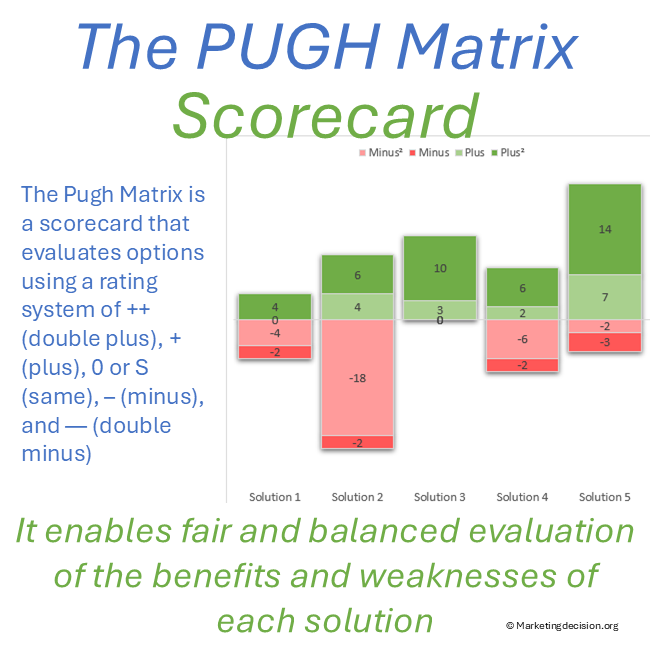
Why the Linear Scorecard Approach?
The linear scorecard calculates a score as a weighted sum across multiple criteria, each represented on a linear scale.
Its key advantages include:
- Simplicity and transparency of calculation
- Ability to combine qualitative and quantitative criteria
- Clear overall evaluation supported by structured discussion
- Flexibility across different use cases and time horizons
The final score provides a solid basis for discussion, allowing teams to challenge assumptions and validate conclusions.
Linear Scorecard Methodology
Implementing a weighted decision scorecard is a structured and collaborative process. It can be revisited dynamically, especially during stakeholder discussions.
Step 1: Define Scope and Stakeholders
Ensure the decision context is clearly defined.
Identify objectives, scope, and key stakeholders.
Involve participants early to capture different perspectives and priorities.
This step may evolve as discussions progress.
Step 2: Select and Structure Criteria
Define the list of criteria used to compare solutions.
- Include both technical and non-technical dimensions
- Group criteria into categories when relevant
- Ask: What defines success? What issues need to be resolved?
Ensure the list is comprehensive before applying weights.
Step 3: Evaluate Solutions Consistently
Populate the scorecard:
- List solutions
- Score each criterion using a consistent scale (e.g. 0–10)
- Apply weights to reflect importance
Ensure consistency and clarity in scoring rules.
Step 4: Review Results and Test Sensitivity
Review outcomes with stakeholders:
- Analyze total scores and category performance
- Test different weighting scenarios
- Challenge assumptions and conclusions
This step strengthens decision robustness and acceptance.
How to Build an Effective Scorecard with Your Team
Building a scorecard goes beyond preparing a spreadsheet. It requires collaboration and alignment.
- Engage stakeholders throughout the process
- Encourage discussion and iteration
- Validate assumptions collectively
- Maintain a clear scope and avoid overcommitments
A well-built scorecard improves both decision quality and team alignment.
When to Use a Linear Weighted Model
This approach is particularly useful when:
- Multiple criteria must be considered simultaneously
- Decisions involve several stakeholders
- Both qualitative and quantitative factors are important
- Transparency and justification are required
It is a reliable framework for complex decision environments.
Features
Save this tool once downloaded for future use. A copy should be created for each new application.
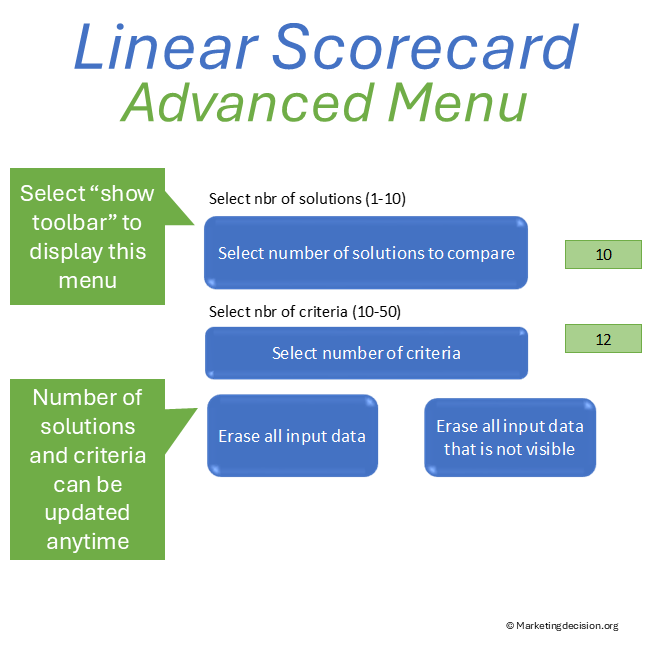
On the “Comparison” page, select “Show Toolbar” to access parameters:
- Set number of solutions (up to 10)
- Define number of criteria (up to 50)
- Reset the full table or hidden cells
- Customize visualization colors
The tool includes full access to macros for customization.
Links and References
Campaign prioritization becomes clearer when tied to promotion objectives. Refer to Promotion Strategy for alignment with communication goals.
Scorecards gain meaning when connected to purpose and alignment. Refer to the Decision Mix to reinforce decision consistency.
Usage & Licensing
This product is intended for professional use only. Please review the Sales Conditions to fully understand your rights and usage limitations.
Licensed for a single business unit (up to 100 employees)
Additional licenses required beyond this scope
Download link valid for 2 months
Up to 10 downloads allowed
Users have full access to the application, including embedded macros, and may adapt it to their needs. However, all branding, trademarks, and references must remain visible and unchanged.
Ensure that you have Microsoft Excel and a PC running Windows before purchasing this application. This application uses advanced dynamic range calculations introduced by Microsoft. Please ensure that you are using a compatible version of Excel, such as Microsoft 365, or any version released after Excel 2019 which supports this feature.
We appreciate your feedback on how to improve this application. Feel free to share your suggestions with us at contact@marketingdecision.org