A significant step in understanding the market environment involves analyzing and calibrating market risks and opportunities to reduce uncertainty and focus collective attention. 
Opportunities represent potential future gains that your company and competitors will consider and pursue. Risks, on the other hand, have the potential to harm existing capabilities and the overall market.
The Risks and Opportunities Matrix considers both aspects using the same axes for analysis: probability of occurrence and impact scale. It can sometimes be challenging to categorize an event as either a risk or an opportunity. One event may be perceived as positive for some while being viewed as negative or a threat by another.
This is why the consideration of positive or negative impact, whether it is a risk or opportunity, should be kept for the next step—after all risks and opportunities have been identified, and when possible actions are discussed.
Thanks to tools such as PESTLE analysis and Porter’s Five Forces, many external market risks and opportunities can be identified. Analyzing these events helps determine the future course of companies.

The Marketing Risks and Opportunities Matrix serves as a valuable tool for summarizing these findings. It assists in prioritizing which events should be reviewed first to gain a deeper understanding of their implications and the actions to be taken.
This tool acts as an organizing interface between two critical marketing stages:
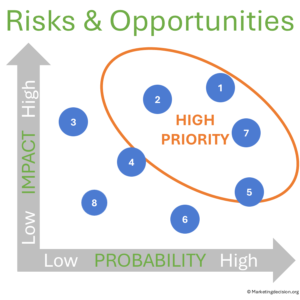
 Measurement of both risks and opportunities along two axes: impact and probability of occurrence. This evaluation highlights the most critical topics, particularly those in the quadrant indicating high impact and high probability.
This consolidation is the work of a team or multiple teams, possibly each focusing on different market opportunities and competitive risks. The starting point—identification of risks and opportunities—is usually complete because they have been identified through prior work, using PESTLE or Porter’s Five Forces.

The team will determine the probability and impact score for each risk and opportunity, using a scale for each dimension. The objective is not to obtain an exact value but to compare relative values.
Any preferred scale can be used. These are inevitably estimates and can be framed for a specific time span if necessary. Once completed, the risk assessment matrix can be populated.

Lastly, the team will discuss each risk and opportunity, starting with the one in the top right quadrant (highest probability, maximum impact).
Here the objective is to recommend a course of action and possible mitigation strategy. At this point, it is good practice to clarify the “why” in detail, not only the “what” and “how”. Clarifying the “why” gives meaning to the proposed action.
Some events may simply be monitored or revisited later, once additional information or context becomes available.
 This tool allows you to display a list of risks and opportunities events that you have identified. They can be showcased on a bi-dimensional matrix with two axes defined as Impact and Probability of occurrence.
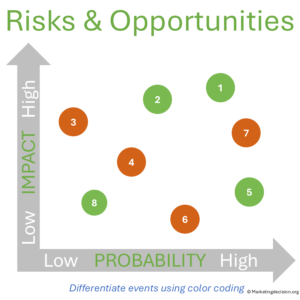
Bubbles can be displayed with different relative sizes if some risks and opportunities need to be highlighted, or to differentiate between them using another criterion (such as $ impact).
Categories can be assigned to each event so they can be displayed in different colors. This feature enables the highlighting of events based on whether they are considered positive, negative, or undetermined, or to differentiate based on market segment.

Explore tools related to the topics covered in this section. For a wider selection, visit our webshop using the link below, or continue browsing our marketing mix pages for additional insights and solutions.