Portfolio Graph: Aligning Sales and Marketing on Solution Value and Positioning

Portfolio Graph

Portfolio Graph

A Portfolio Graph is a structured approach used to visualize how company solutions — and sometimes those of competitors — compare in terms of perceived value across different market segments. Unlike simple ranking charts, this method focuses on value rather than price, helping teams align on how each solution should be positioned and discussed.

Different graphs can be created for each market segment, where customer perceptions and expectations vary. These visual comparisons become valuable discussion tools that connect marketing strategy and sales execution.

Understanding the Portfolio Graph

portfolio graph - A synthetic description of solution offerings for a given segment
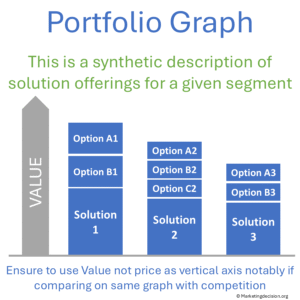
The Portfolio Graph highlights value mapping across solutions. By displaying the relative value of each offering, it guides teams to discuss how solutions should be positioned both within the company’s portfolio and in relation to competitors.

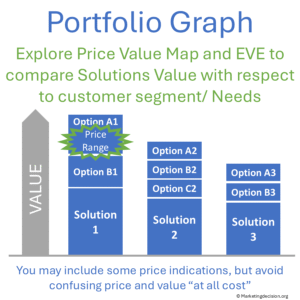
Although price ranges may appear directly inside the graph, the vertical axis should always represent perceived value, not price. This ensures discussions remain centered on what truly matters — value — while still allowing teams to indicate estimated price levels when needed for clarity.

This approach is especially effective for marketing and sales collaboration, as it enables both teams to visualize how solutions compete in each segment and to define consistent sales arguments and positioning strategies.

Focusing on Perceived Value, Not Price

Marketing and sales often fall into the trap of linking positioning directly to price. The Portfolio Graph avoids that by emphasizing perceived value — the customer’s understanding of a solution’s benefits, differentiation, and relevance.

When positioning discussions are value-centered, teams stay focused on how to differentiate offerings, highlight strengths, and communicate unique advantages. In contrast, when the vertical axis reflects price, it sends the wrong signal — that pricing alone determines competitiveness.

For detailed analysis of price dynamics, teams can use a complementary tool, the Price–Value Map, which examines how price relates to perceived value.

How Marketing and Sales Use the Portfolio Graph

Presenting solutions and configurations by comparing their perceived value is usually led by marketing teams. During regular meetings, these discussions help:

  • Align marketing and sales on product and solution positioning.

  • Identify gaps or overlaps in the offering portfolio.

  • Adjust pricing strategies or go-to-market approaches when needed.

By sharing a clear visual reference, teams can make better strategic decisions and maintain a consistent message across all segments.

Reviewing Positioning and Sales Arguments

To make the most of the Portfolio Graph, teams should use it regularly to review and update solution positioning. In sales meetings, use it to:

  • Explain why your solution is superior, based on facts and customer value.

  • Anticipate competitor claims and prepare clear, objective responses.

  • Encourage customers to evaluate competitors critically and ask informed questions.

These discussions promote constructive collaboration and fact-based alignment, ensuring both marketing and sales teams work from the same understanding of solution value.

Tips for Effective Use

  • portfolio graph - allow to include price information as found necessary - but not confused it with valueAvoid using the value axis as a price axis — this undermines the purpose of the graph.
  • Keep the focus on customer-perceived value and its link to competitive differentiation.

  • When relevant, add price points or ranges directly inside the graph to clarify solution price levels without replacing the value-based scale.

  • Update graphs regularly with the latest Voice of the Customer (VOC) feedback and market insights.

  • Encourage feedback from sales teams; differing views may indicate new competitor moves or shifting customer expectations.

Turning Analysis into Clear Sales Messages — The Four Blockers

Beyond positioning discussions, the Portfolio Graph can be complemented by a Four Blockers visual — a simple yet powerful communication tool that extends analysis into actionable sales dialogue and training.

portfolio graph - 4 blockers to communicate internally

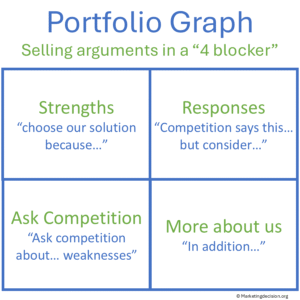
The Four Blockers help marketing and sales teams translate complex comparisons into concise, structured messages. Preparing this visual requires additional work to clarify strengths and weaknesses among the solutions targeted for discussion. The result is a clear, one-page reference that helps sales teams articulate how each solution performs against competitors — both in capabilities and in perceived customer value.

Used alongside the Portfolio Graph, this visual helps teams:

  • Clarify competitive contrasts – Identify which features or capabilities truly differentiate your solutions from competitors.

  • Strengthen value messaging – Frame these differences as customer benefits rather than technical features.

  • Equip sales for dialogue – Provide a ready reference to question competitor claims and emphasize the strengths of your own solutions.

  • Extend alignment beyond positioning – Ensure that value communication, not just value mapping, becomes part of every customer conversation.

Together, the Portfolio Graph and the Four Blockers turn analysis into a communication and training toolkit. They provide sales teams with the structure and confidence to navigate competitive discussions, promote solution strengths, and challenge opposing arguments effectively — all while maintaining a consistent, customer-focused message.

In Summary

The Portfolio Graph offers a simple yet powerful way to align marketing and sales around solution value and positioning. While its simplicity enhances communication, it should be complemented by other tools such as the Strategic Position Analysis Tool and the Price–Value Map for deeper evaluation.

By focusing on perceived value — not price — teams can sharpen their positioning, strengthen sales arguments, and guide investment and portfolio decisions more effectively.

A similar perspective can be found in McKinsey’s article “Making Brand Portfolios Work”, which discusses how companies structure and communicate brand portfolios to clarify market positioning and customer perception. Although centered on brands, the approach has many parallels with solution portfolio design — particularly the importance of comparing offerings through the lens of perceived value.

Portfolio prioritization becomes sharper when aligned with customer segments. For segmentation foundations, visit Customer Segmentation Principles.

Interpreting solution attractiveness requires clarity on customer needs, behaviors, and expectations. For this foundation, review our Customer Mix analysis.

Portfolio graphs become more meaningful when anchored in value creation principles. For these foundations, see our Value Creation page.

When comparing solution positions, pricing plays an essential role. For a deeper understanding of value-based pricing, see our Value Pricing chapter.

Portfolio graphs gain relevance when positioned within the Solution Mix framework, which defines the structure and differentiation of your solutions.

Some solutions require specific channel approaches. See Place Mix Strategy to understand how placement supports solution priorities.

Solution positioning becomes actionable when linked to value selling narratives. For practical guidance on strengthening these messages, refer to our Value Selling chapter.

FAQ – Portfolio Graph

What is a Portfolio Graph?

It is a structured approach for visualizing the relative value of solutions across market segments, helping marketing and sales align on how to position and communicate solution advantages.

The Portfolio Graph focuses solely on perceived value, while the Price–Value Map adds a second dimension — price — to analyze competitiveness.

Because perceived value shapes how customers evaluate relevance and benefits — the key drivers behind their willingness to choose or pay for a solution.

© marketingdecision.org

Tools

The following section may include tools, some free, some with a fee to support this site development. If you consider a tool should be presented in this section and is missing, please let us know at: contact@marketingdecision.org

Visit our Webshop

marketing decision shop access image

Explore tools related to the topics covered in this section. For a wider selection, visit our webshop using the link below, or continue browsing our marketing mix pages for additional insights and solutions.

© 2025 MARKETING DECISION SOLUTIONS. All Rights Reserved.