It is key to consistently question and assess the notion of market presence. Is the company actively engaged in growing market segments? Are investments being made in the right areas? Where should marketing communication and promotion costs be allocated for optimal results?
While these tools may appear highly strategic, catering to long-term perspectives, they also serve as invaluable aids in facilitating discussions and enhancing visibility within a business context.
 Enhanced visibility of market size, trends, and the company’s share through simplified and clear graphical representations.
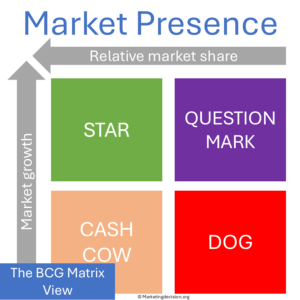 The BCG matrix is a classic tool that provides a comprehensive overview of different market segments, enabling an understanding of their growth potential and relative market share. This information is highly influential in making strategic decisions. A segment that demonstrates both growth and a high market share, resulting in lower manufacturing and delivery costs, is considered an advantageous position.
For more detailed information on the BCG matrix, you can refer to:
Website: https://www.professionalacademy.com/blogs/marketing-theories-boston-consulting-group-matrix/
Article: https://www.bcg.com/fr-fr/publications/2014/growth-share-matrix-bcg-classics-revisited
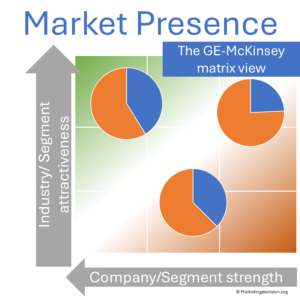 Similar approaches have been developed by other organizations, and the GE–McKinsey matrix offers a robust, more nuanced perspective on portfolio analysis and strategic prioritization. Unlike the BCG matrix’s simple four-quadrant structure, the GE–McKinsey framework uses a three-by-three grid to evaluate each business unit or initiative based on industry attractiveness and competitive strength, with greater flexibility to incorporate multiple underlying factors for each axis, such as market size, growth, profitability, competitive intensity, brand equity and distribution capabilities.
Ideally, share is represented on the graph in a way that each bubble gives a clear, comparative view of both your own position and competitors’ positions within the same market context. This means you can plot not only your relative share but also assess it against other players to enrich strategic discussions and investment decisions.
You can find an insightful overview at: https://www.professionalacademy.com/blogs/marketing-theories-ge-matrix/
 Creating these matrices can be a complex task. Defining market attractiveness, determining it, and evaluating company strength within segments all pose challenges.
Initially, you can draw on your market knowledge to construct these matrices.
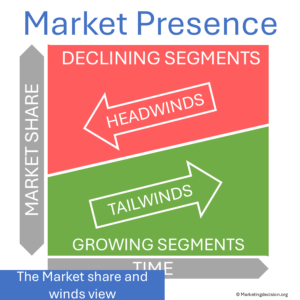
The Market Share & Winds model offers metrics across segments, including segment growth and company share within those segments.
A third dimension accounts for segment size and/or the company’s size within that segment.
With these dimensions, you can address critical questions:
A graph generated by the Market Share & Winds tool, featuring two axes representing company share and segment growth (with bubble size indicating company volume), provides a valuable visualization approach.
For more advanced representations, consider combining market segment size and growth on the vertical axis. A segment is genuinely attractive if it boasts a considerable size and substantial growth. Finally, you can use market share to determine the bubble size.
In summary, leverage your market data consolidation to assess these matrices. Graphics can be easily adjusted to depict market segment criteria as two-dimensional axes.
Here an excellent article comparing these two tools: BCG tool and GE Matrix models — a must-read:
https://www.linkedin.com/pulse/mckinsey-ge-mapa-model-vs-bcg-paulo-brandao-mba-cfe/

The GE matrix model may seem more complex to develop, especially since axes are not directly related to metrics easily measurable. Its interest lies in the flexibility it provides to include hypotheses that cannot be measured but can be assessed, such as emerging new technologies.
With that perspective, the GE model’s key benefit is to ask two essential questions representing the two axes of the graph:
Why is this segment attractive? What are my strengths in this segment and can I grow them?
Here is another excellent article about the BCG matrix, easy to read and with examples: https://www.investopedia.com/terms/b/bcg.asp
The value of the BCG matrix lies in the simplicity of its calculation (although this can be a rearview mirror perspective if assessment for the future is solely based on past trends).
It questions companies on how to improve their competitive situation in market segments.
It encourages management to consider where to invest to improve competitive presence and grow faster on growing segments.
Profitability remains a key parameter to keep visible throughout these discussions.
If your offering in a “dog” segment is highly profitable, you may wish to maintain a presence there.
Read also: Comparison and Usage of the Boston Consulting portfolio and the McKinsey portfolio by Bäuerle M., Görne J. —
https://fr.scribd.com/document/464678804/Comparison-and-Usage-of-the-Boston-Consulting-portfolio-and-the-McKinsey-portfolio-Maximilian-Bauerle
 These views focus on facilitating decision-making regarding capital investments. However, they can also be leveraged to understand the company’s relative strengths and weaknesses in the market.
This perspective is particularly beneficial for Sales and Marketing managers, as it provides clarity on short-term and long-term priorities.
Presence metrics gain depth when interpreted alongside customer motivations and expectations. For a broader perspective, visit our Customer Mix page.
Presence indicators are easier to interpret when connected to market structure and competitive forces. Visit the Market Mix page for the underlying market dynamics.
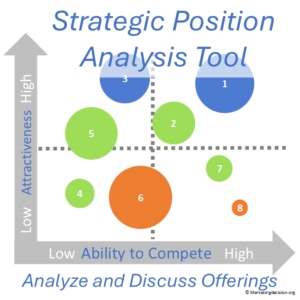
The Excel-based Strategic Position Analysis Tool is designed to compare projects by providing a clear visual method to assess, discuss, and prioritize initiatives.
It can be used effectively to represent market segments in a way similar to the BCG Matrix. In this configuration, the horizontal axis represents relative market share, the vertical axis shows the relative growth of each market segment, and the bubble size reflects the size of the market segment. This visual representation makes it easier to structure and enrich strategic discussions.
Segments positioned further to the right indicate a stronger market share position. Segments higher on the chart represent growing—and therefore potentially attractive—market segments. Bubble size becomes a powerful indicator of actual market size during strategic discussions.
The tool allows you to:
This practical visualization tool supports informed discussions and helps prioritize actions that align with your company’s strategic objectives.

Explore tools related to the topics covered in this section. For a wider selection, visit our webshop using the link below, or continue browsing our marketing mix pages for additional insights and solutions.