Description
When defining a go-to-market strategy, companies must decide between direct vs indirect sales and choose the most suitable distribution model.
The proposed Excel tool can support discussions and evaluations of criteria to guide a decision between these two approaches. Choosing between direct and indirect sales commits the company to long-term engagements.
This structured approach helps teams compare direct vs indirect sales models based on consistent criteria and business priorities.
Evaluate the Strengths and Weaknesses of Direct vs Indirect Sales
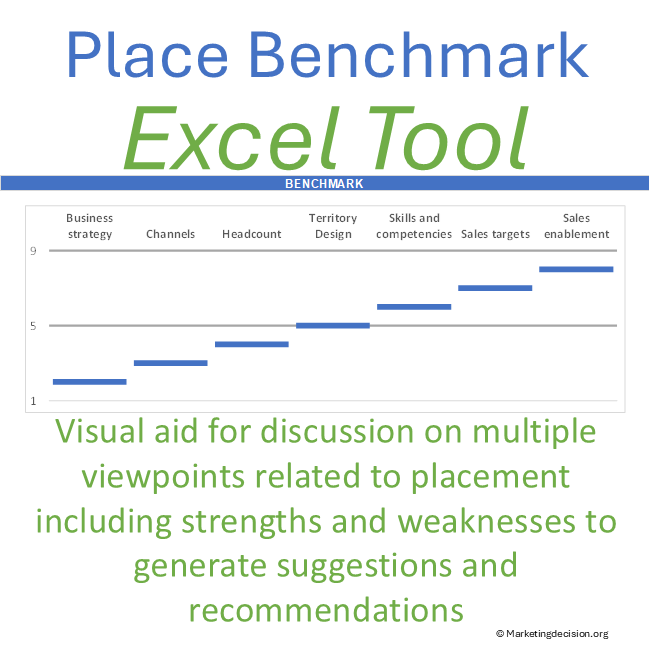
This tool is designed to facilitate a structured discussion among team members. By addressing one topic at a time, the discussion can focus on the strengths and weaknesses of different solutions. Whether or not there is agreement on the scale for each category, these discussions help in understanding how direct and indirect approaches align with the business strategy.
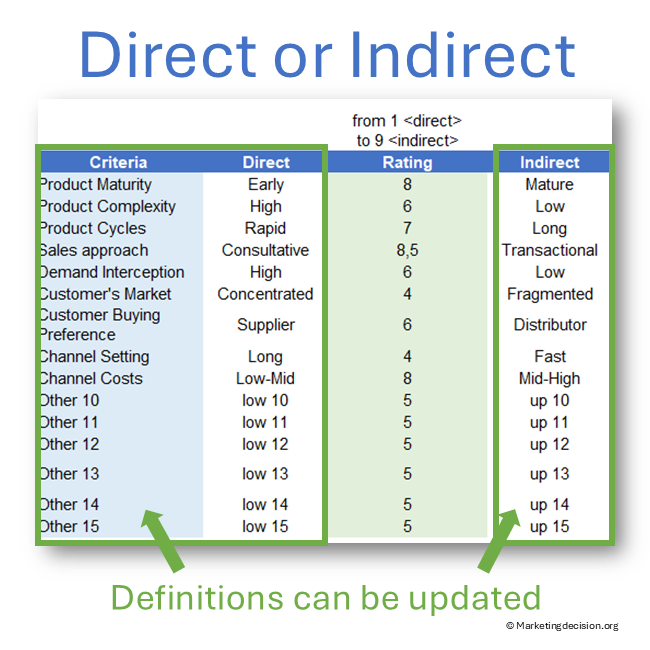
The key benefit of this application is that it paves the way for decision-making by leveraging multiple business viewpoints and technical perspectives. The proposed list of categories, which can be customized if needed, includes:
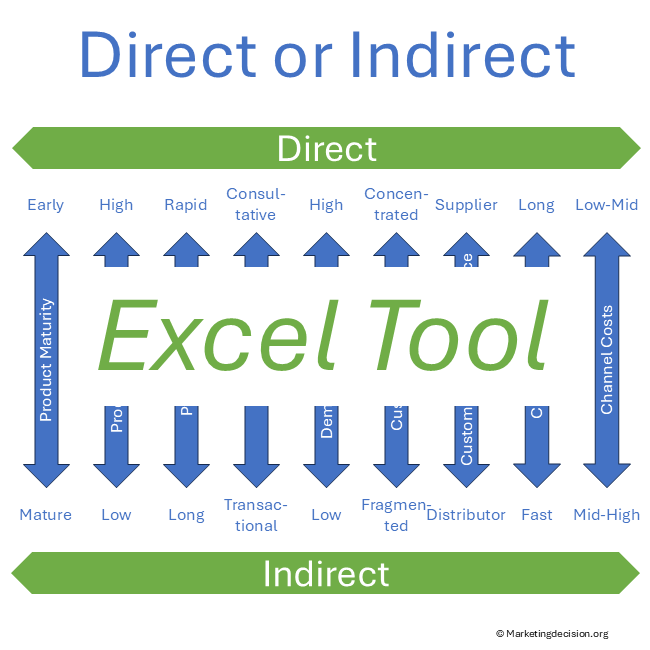
- Product Maturity: A mature product solution can be sold through an indirect channel, unlike a product that is evolving and leveraging new technology being tested in the market.
- Product Complexity: Products with high complexity may not fit with an indirect channel organization unless advanced technical support is available. Such networks add costs from both direct and indirect teams.
- Product Cycles: A rapidly evolving product, with new models frequently coming to market and making prior versions redundant, may pose a challenge for an indirect sales team.
- Sales: When sales require multiple interactions and customer visits, direct sales operations may be more efficient. Indirect teams, however, can quickly evaluate and capture new opportunities with less transactional sales effort.
- Demand Interception: Are opportunities easily identifiable, or do salespersons need to invest significant time and effort to find them?
- Customer’s Market: Is the market consolidated and easily reachable for a direct sales team, or fragmented and more suitable for an indirect organization?
- Customer Buying Preference: Are customers comfortable buying from distributors rather than directly from suppliers?
- Channel Setting: Is there a preference for quickly establishing the distribution channel, or a more gradual approach to learn from customer needs and preferences? A staggered approach allows for more feedback and adjustments to the solution offering, which may be suitable for a direct organization.
- Channel Costs: What are the cost estimates for both approaches, and which is preferred?
Application Benefits
A key benefit of this tool is that it facilitates discussion on multiple viewpoints related to direct vs indirect sales. All aspects of these operations can be discussed, and multiple teams can be involved. Once a solution emerges, factors can be reviewed to address risk mitigation and consider successful factors for implementation.
Prefer a quick visual overview before exploring the features?
Tool Capabilities
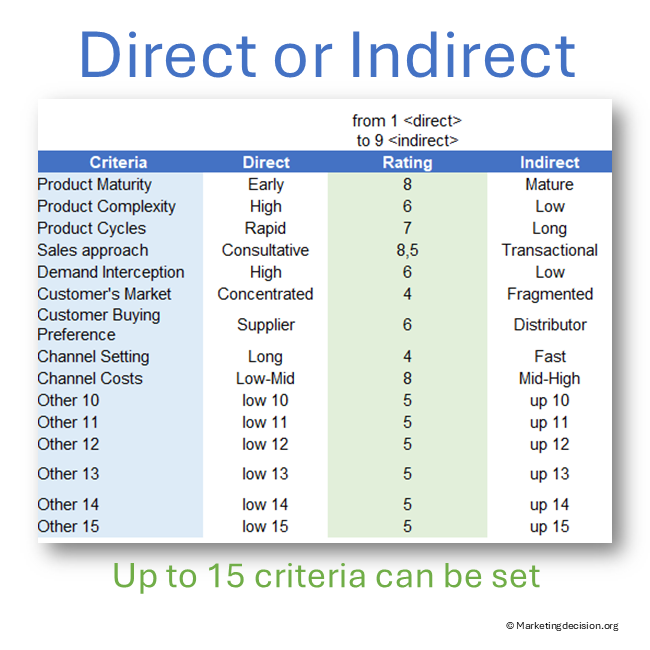
This tool allows users to display and evaluate multiple criteria when assessing direct or indirect organizational operations. The proposed factors can be fully customized, with a maximum of 15 criteria supported in this version.
The tool comes with preset criteria categorized into nine dimensions:
- Product Maturity
- Product Complexity
- Product Cycles
- Sales Approach
- Demand Interception
- Customer’s Market
- Customer Buying Preference
- Channel Setting
- Channel Costs
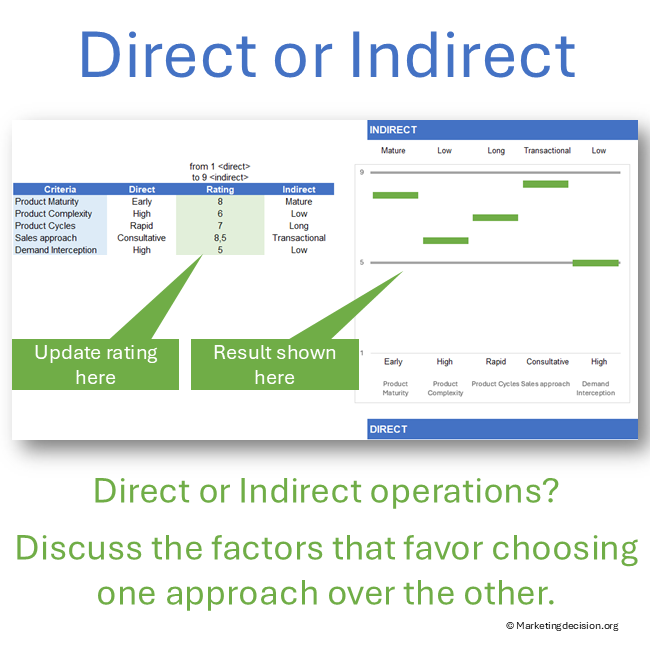
Rating along each criterion must range from 1 to 9 (1 = Direct strongly preferred, 9 = Indirect strongly preferred).
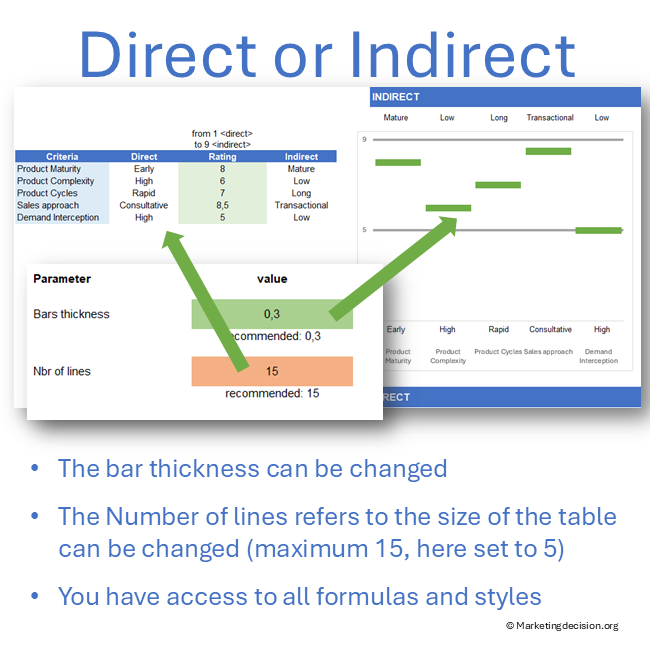
Setting data and changing criteria titles: This is done on the same tab where results are shown. This allows you to dynamically see the result of updating parameters, whether in a team meeting or other circumstances.
Additional Capabilities
- The bar thickness can be updated for proper visualization.
- The number of lines refers to the size of the table, set to 15 in this version. Update this number if you want to change the number of categories on the graph. Usually, a number between 5 and 10 is sufficient once the file is customized.
When changing the number of lines, the graph legends will need to be realigned. For users with Excel knowledge, it will be easy to move the graph and adjust the position to align legends as indicated in the Excel file. If too complex, keep the number of lines to the original value and copy/paste the part of the presentation you wish to keep, for instance, in a presentation. If in a workshop with a team, keep the legends available for update and corrections as found required.
In Summary
This Excel tool, designed without macros, facilitates the review and discussion of the benefits and challenges of direct vs indirect sales. It supports the development of tailored scenarios across business teams and can be optimized to suit your specific environment and needs:
- Marketing teams can use the tool to develop arguments in favor of either direct or indirect sales for various product or regional segments.
- Teams can assess the current sales approach for a specific segment, identify associated challenges and opportunities, and articulate alternative scenarios.
In both cases, a predesigned template can be proposed – this Excel tool or another with pre-populated criteria – or a blank template for teams to develop their own list of criteria.
Additionally, other tools available on this site may complement this one, such as tools designed to compare solutions based on importance and impact. In workshop settings, where participants share suggestions and recommendations, this tool can enhance collaboration by enabling teams to share, discuss, and prioritize various solutions effectively.
Understanding channel strategy is essential when choosing between direct vs indirect sales models. See Channel Strategy to explore how these approaches fit into a broader go-to-market framework.
Usage & Licensing
Please review the Sales Conditions published on this website to fully understand your rights and the restrictions regarding the use of this product. Our products are intended for professional use only and are not designed for consumer purposes.
The products provided under this agreement are exclusively for the individual buyer or members of the same business unit. Sharing, distributing, or making them available to individuals or teams outside the designated user or relevant business unit is strictly prohibited. For software licensing purposes, a business unit is limited to a maximum of 100 employees, including full-time, part-time, and temporary staff. Additional licenses must be purchased in multiples of 100 if this limit is exceeded.
The provided download link is valid for two months and allows up to 10 downloads. Be sure to save a copy before the link expires or the download limit is reached. Users have full access to the application product, including any embedded macros, and may make necessary adjustments to suit their needs. However, all branding, trademarks, and references to marketingdecision.org must remain visible and intact within the application.
Ensure that you have Microsoft Excel and a PC running Windows before purchasing this application. This application uses advanced dynamic range calculations introduced by Microsoft. Please ensure that you are using a compatible version of Excel, such as Microsoft 365, or any version released after Excel 2019 which supports this feature.
We appreciate your feedback on how to improve this application. Feel free to share your suggestions with us at contact@marketingdecision.org