Description
When to Use This Benchmark Template Excel
This benchmark template Excel is particularly useful in the following situations:
- When evaluating a sales organization or channel structure
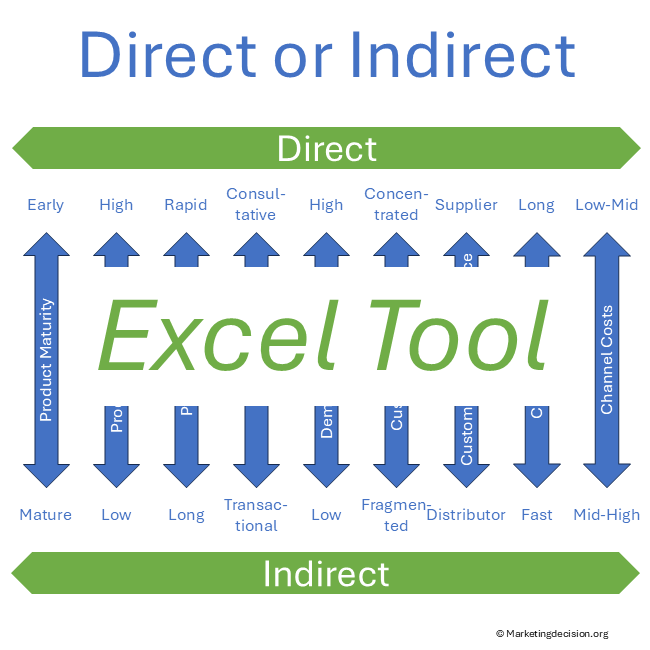
- When comparing direct vs indirect sales models
- When preparing a Go-to-Market transformation
- When aligning teams before strategic decisions
- When identifying performance gaps across regions or segments
This type of evaluation is typically part of a broader Channel Benchmark approach used to assess and optimize Go-to-Market performance.
What This Benchmark Template Excel Does
This Excel-based benchmarking template enables teams to:
- Assess current sales and distribution performance (AS-IS)
- Define and evaluate target organization models (TO-BE)
- Compare different channel strategies or structural options
- Identify performance gaps and improvement opportunities
- Structure discussions across multiple stakeholders
By organizing evaluation criteria in a consistent format, the tool helps turn fragmented opinions into structured, comparable insights.
Evaluate Sales Channels with This Benchmark Template Excel
This benchmark spreadsheet is specifically adapted to assess Go-to-Market and placement strategies, including:
- Direct vs indirect channel effectiveness
- Sales and support organization balance
- Territory structure and coverage
- Channel collaboration and conflict management
- Sales enablement and support capabilities
It provides a clear view of how your organization delivers products and services to the market.
This benchmark template Excel can also be used to compare sales organization models and channel structures in a consistent way.
Prefer a quick visual overview before exploring the features?
How the Benchmarking Template Works
The tool is based on a simple and effective scoring model:
- Each category is evaluated on a defined scale (e.g. 1 to 9)
- Multiple dimensions can be assessed simultaneously
- Individual inputs can be consolidated into a shared view
- Results can be visualized for easier interpretation
This evaluation template Excel supports fact-based discussions and helps teams focus on what truly differentiates performance.
Key Benefits of the Benchmark Spreadsheet
Using this benchmark template Excel helps organizations:
- Improve alignment across sales, marketing, and support teams
- Encourage structured and objective discussions
- Reveal strengths, weaknesses, and improvement priorities
- Support Go-to-Market transformation initiatives
- Establish a clear baseline for measuring progress over time
It is particularly valuable when preparing or evaluating changes in sales organization or distribution strategy.
Example of Sales and Channel Benchmarking
For example, a company reviewing its indirect channel strategy can use this benchmark template Excel to compare regions, assess support functions, and identify gaps in sales coverage before defining a new Go-to-Market model.
Flexible and Customizable Excel Template
This benchmarking spreadsheet is designed for practical and flexible use:
- Fully customizable categories and evaluation criteria
- No macros required
- Compatible with modern Excel versions
- Dynamic charts for visual representation
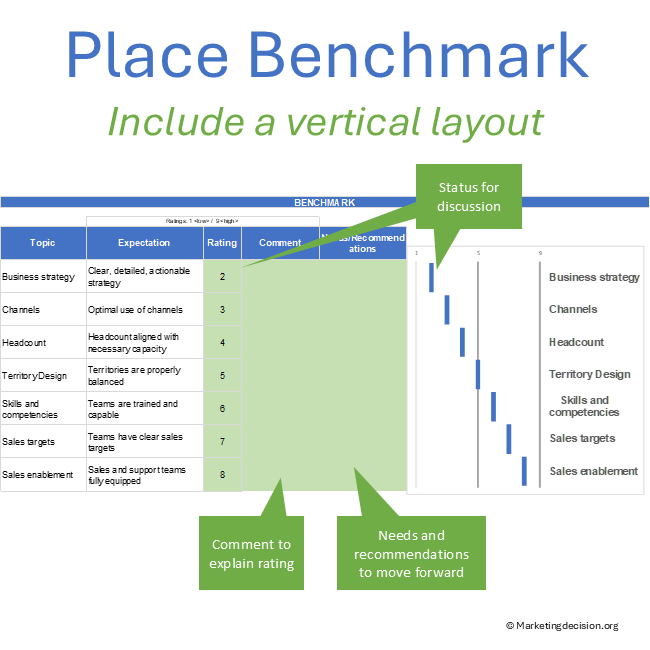
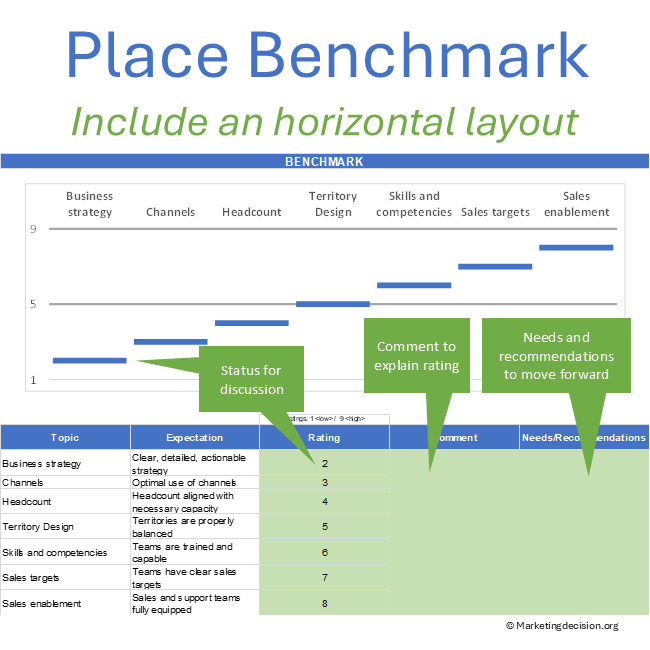
- Two layouts available (horizontal and vertical formats)
The template can be adapted to your industry, business model, and organizational structure.
This benchmark spreadsheet Excel format makes it easy to compare multiple evaluation dimensions and adapt the tool to different decision contexts.
Supporting Structured Team Discussions
A key strength of this benchmark template Excel is its ability to support collaborative evaluation.
By sharing the template before a workshop, participants can:
- Provide individual assessments
- Highlight differences in perception
- Identify gaps and priorities
- Build a shared understanding of improvement areas
This makes the benchmarking process both analytical and engaging, leading to stronger alignment and better decisions.
This template is particularly useful before major sales or channel transformation decisions. Most teams use this benchmarking spreadsheet to structure workshops and align stakeholders.
How This Tool Fits Within Your Go-to-Market Strategy
This benchmark template Excel complements broader strategic analysis and helps translate concepts into practical evaluation.
This benchmark template Excel is based on the Channel Benchmark framework, which is used to assess sales channels, support functions, and Go-to-Market organization in a structured way.
This tool can also be used alongside other decision tools such as:
- Weighted decision scorecards
- Stakeholder analysis frameworks
- Scope definition tools
Together, these tools support structured, transparent, and effective decision-making.
See also the Place Mix Strategy page for additional context and strategic foundations in the broader placement framework.
Tool Structure and Key Features
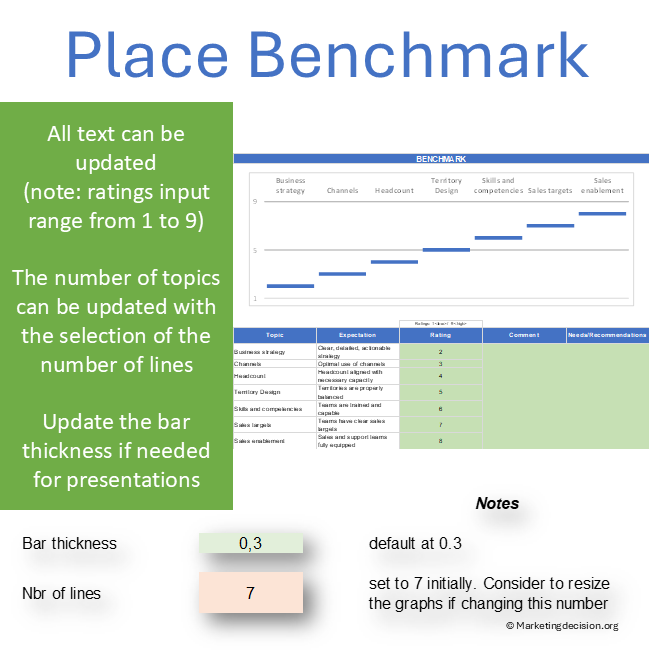
The benchmark template Excel is structured around a set of predefined categories designed to support a comprehensive evaluation of your Go-to-Market organization.
Predefined evaluation categories
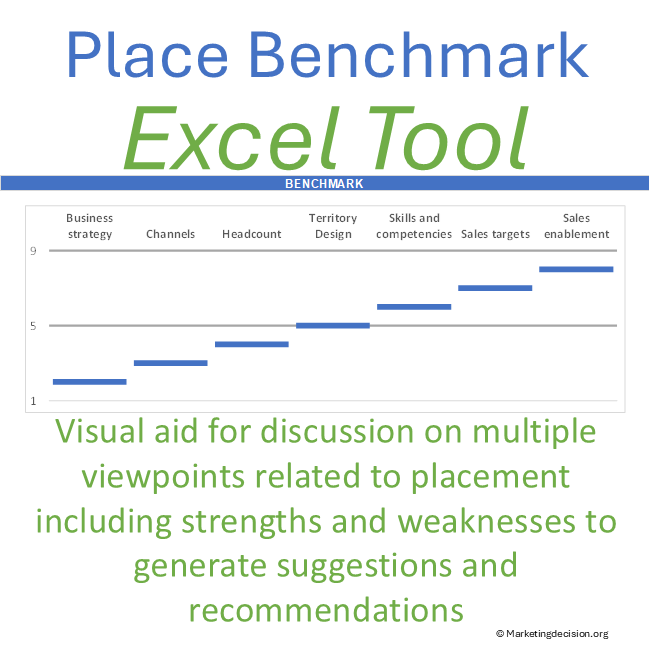
The template initially includes the following categories:
- Business strategy
- Channels
- Headcount
- Territory design
- Skills and competencies
- Sales targets
- Sales enablement
These categories reflect the key dimensions used to assess sales organization effectiveness and channel performance.
They can be fully customized and extended depending on your specific context, industry, or organizational structure.
Flexible scoring system
Each category is evaluated using a fixed rating scale from 1 (low) to 9 (high).
This consistent scale ensures:
- Clear comparison across categories
- Reliable visualization in Excel charts
- Stability of the graphical representation regardless of formatting
You may define your own interpretation of each score to reflect your internal standards and evaluation criteria.
Structured qualitative input
To complement quantitative scoring, the tool includes two dedicated areas for qualitative input:
- Comments → to explain and justify the selected rating
- Needs / Recommendations → to capture improvement ideas, transformation proposals, and action points
These sections ensure that benchmarking is not limited to scoring, but leads to meaningful insights and actionable outcomes.
Advanced Features and Customization Options
The benchmarking template Excel includes additional configuration options to adapt the template to your specific needs and presentation preferences.
Parameter settings for visualization
Within the “Parameters” tab, several elements can be adjusted:
- Bar thickness → improve readability and presentation
- Number of categories (lines) → adapt the evaluation scope
Graph adjustment and layout flexibility
When modifying the number of categories:
- Graph elements can be repositioned
- Legends can be adapted
These adjustments allow full control over the visual presentation.
Extended customization possibilities
- Categories can be modified or extended
- Evaluation criteria can be adapted
- The template supports different benchmarking approaches
Integration with other decision tools
This benchmark template Excel can be used in combination with other frameworks available on this site.
For example:
- Compare improvement options using structured evaluation tools
- Prioritize initiatives based on impact and importance
- Facilitate workshops where teams propose and refine recommendations
This makes the tool not only a benchmarking instrument, but also a starting point for broader decision-making and transformation initiatives.
Usage & Licensing
This product is intended for professional use only. Please review the Sales Conditions to fully understand your rights and usage limitations.
Licensed for a single business unit (up to 100 employees)
Additional licenses required beyond this scope
Download link valid for 2 months
Up to 10 downloads allowed
Users have full access to the application and may adapt it to their needs. However, all branding, trademarks, and references must remain visible and unchanged.
Ensure that you have Microsoft Excel and a PC running Windows before purchasing this application.
We appreciate your feedback on how to improve this application. Feel free to share your suggestions with us at contact@marketingdecision.org