Description
The Challenge of Market Forecasting
Market forecasts are often built on:
- Incomplete or fragmented datasets
- Conflicting external sources
- Different methodologies and assumptions
This makes it difficult to:
- Justify market assumptions
- Align teams on a common view
- Support strategic decisions with confidence
👉 As a result, forecasts can become subjective, inconsistent, and difficult to defend.
This tool addresses these challenges by providing a structured and transparent framework to combine multiple market signals into a single, coherent forecast.
What Is a Market Forecasting Tool?
A market forecasting tool is used to estimate the future evolution of a market or segment based on historical data and relevant indicators.
Quantitative forecasting methods rely on numerical data from multiple sources such as public institutions, industry reports, or internal datasets. These methods help:
- Assess market growth or decline
- Compare different market signals
- Support strategic planning and investment decisions
This tool focuses on multi-metric forecasting, allowing you to align and interpret different data sources in a single structured model.
Why Combine Multiple Metrics in Market Forecasting?
Market data rarely tells a single, consistent story.
Different sources may show:
- different growth rates
- different market sizes
- different trends
Relying on one source can lead to biased or fragile conclusions.
This Excel model enables you to:
- Compare multiple independent data sources side by side
- Identify converging or diverging trends
- Create a weighted average forecast based on selected metrics
👉 The result is a “cocktail of metrics”, where each dataset contributes to a balanced and defendable market estimate.
How This Excel Forecasting Model Works
The tool allows you to:
- Structure and consolidate multiple datasets
- Compare metrics across time and segments
- Apply weighting factors based on relevance or reliability
- Generate a consolidated market forecast
Two complementary approaches are available:
- Absolute analysis → validate and compare raw values
- Relative analysis → analyze trends and build forecasts
👉 This dual approach ensures both data robustness and strategic interpretability.
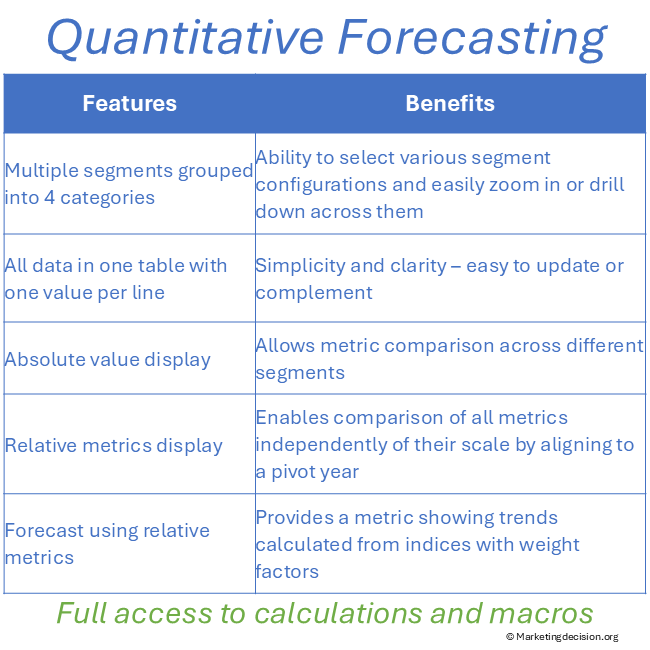
Absolute vs Relative Forecasting Approaches
Absolute Metrics
- Displays values in their original units
- Ideal for validating data consistency and scale
- Supports direct comparison of comparable metrics
👉 This helps ensure that your data foundation is reliable before building assumptions.
Relative Metrics
- Aligns all metrics to a pivot year
- Focuses on growth dynamics and trend evolution
- Enables weighted forecasting across multiple indicators
👉 This allows you to combine different market signals into a single growth assumption, which is essential when data sources diverge.
Building a Market Forecast: From Data to Decision
This tool supports a structured forecasting process:
- Collect data from multiple sources
- Align metrics and ensure consistency
- Compare trends across indicators
- Apply weights based on relevance or reliability
- Generate a consolidated forecast
👉 The result is not just a number, but a transparent, structured, and discussable market assumption.
Why This Tool Is Valuable
This tool goes beyond traditional forecasting templates.
It enables you to:
- Reconcile multiple conflicting data sources into a single market view
- Build transparent and defendable growth assumptions
- Support strategic discussions with structured and credible data
- Reduce uncertainty in market sizing and investment decisions
👉 Instead of relying on a single estimate, you can build a robust forecast based on multiple signals, improving both confidence and alignment across teams.
Who Should Use This Forecasting Tool?
This tool is designed for professionals working with data-driven market analysis, including:
- Strategy and business development teams
- Market analysts and product marketing managers
- Innovation and investment decision-makers
It is suitable for both:
- Experts handling large datasets
Professionals seeking a structured and simplified forecasting approach
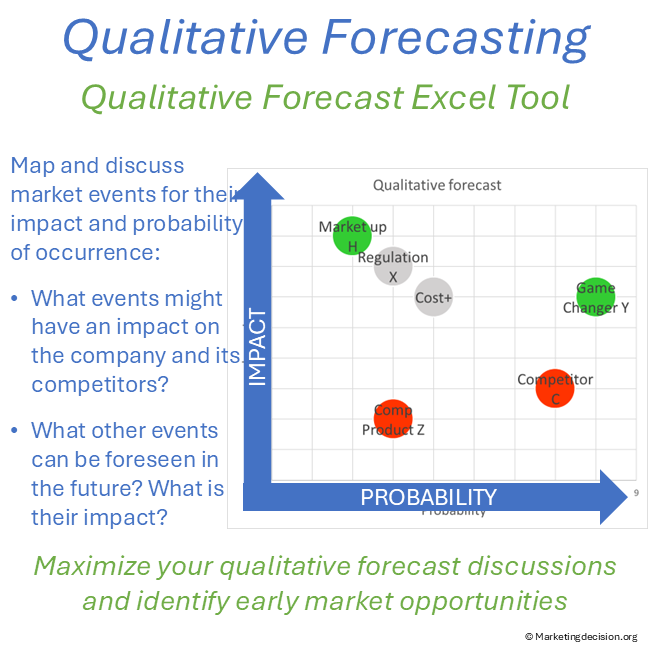
When to Use a Quantitative Forecasting Model
This tool is particularly useful when:
- Multiple data sources need to be aligned and compared
- Market trends are uncertain or contradictory
- Strategic decisions require robust and defendable assumptions
Scenario development is needed to support planning
Prefer a quick visual overview before exploring the features?
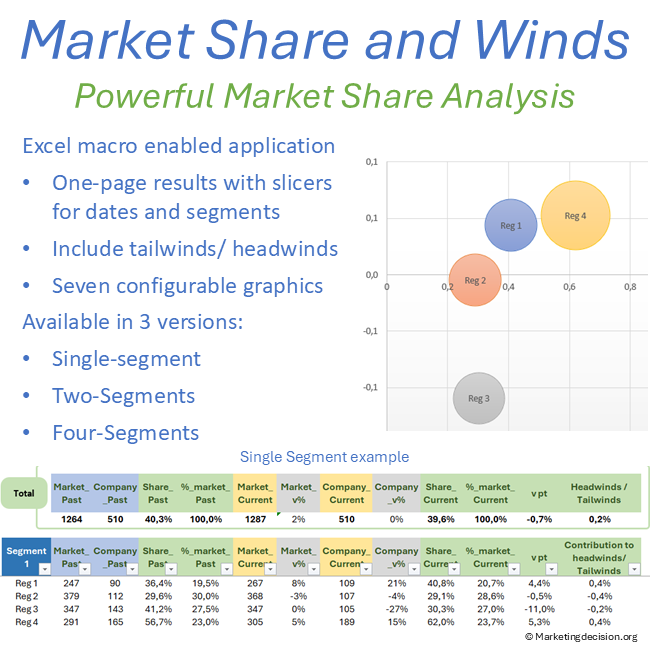
Key Features of the Market Forecasting Tool
The Excel tool is designed for quantitative multi-metric forecasting, organizing data into a consistent time structure and offering two main display modes:
Absolute Mode
- Displays metrics side by side in their original units
- Suitable for comparable datasets
- Allows unit-based filtering and visualization
👉 Decision impact: Helps validate data consistency and reliability before building forecasts.
Relative Mode
- Aligns all metrics to a common pivot year
- Focuses on growth and variation over time
- Enables weighted multi-metric forecasting
👉 Decision impact: Allows you to combine multiple market drivers into a single, structured forecast.
Tool Structure and Usage
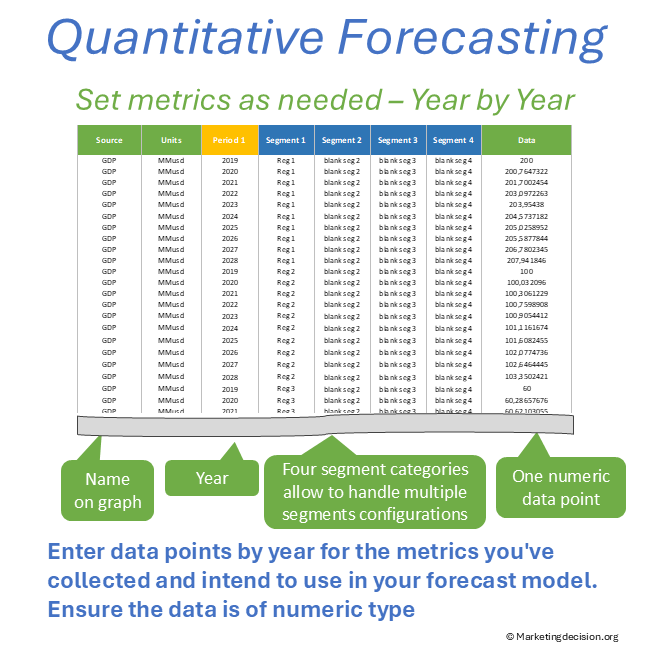
Tab “1. Data by Segment”
This is the data input tab.
- One row = one metric / one segment / one year
- Supports incremental data addition
- Recommended for additive metrics (e.g. volume, population)
Key capabilities:
- Up to 4 slicers (e.g. region, country, business unit, technology)
- Flexible segmentation and filtering
- No strict limit on number of rows
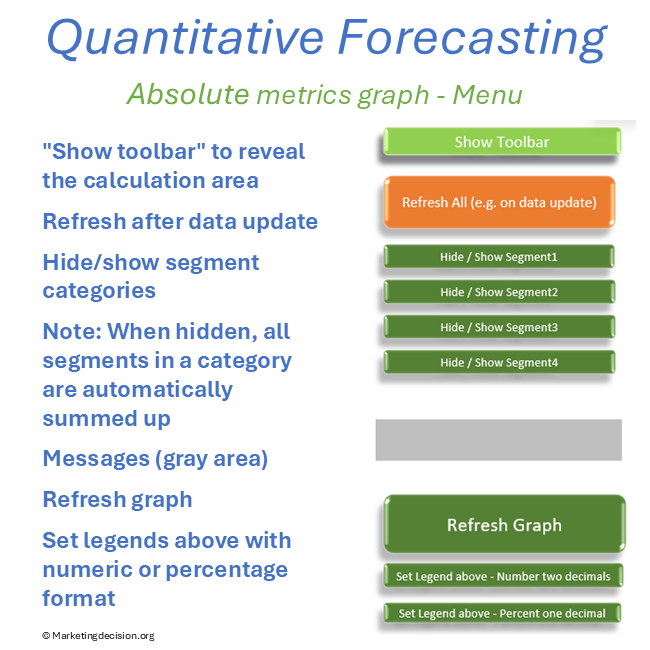
- Refresh button to update all views
- Error detection for non-numeric values
👉 Decision impact: Enables structured data consolidation across multiple dimensions.
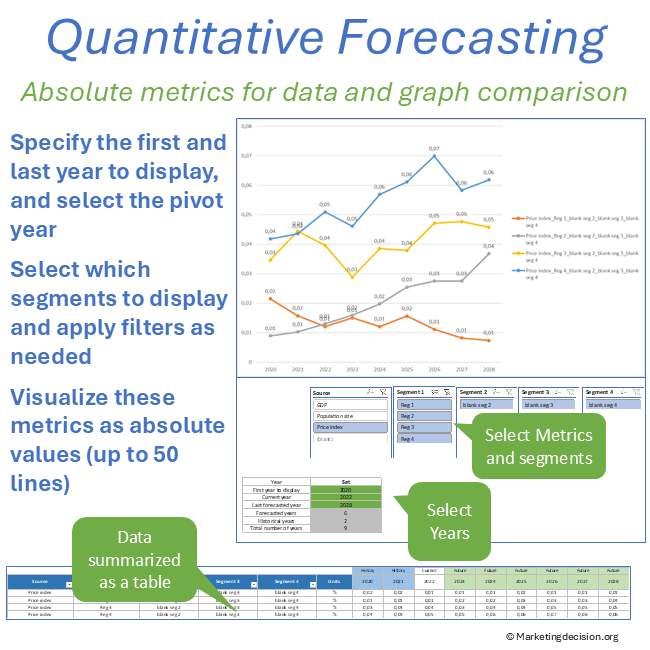
Tab “2. Absolute Metrics”
Displays absolute values across metrics.
Features:
- Select time range (start/end year)
- Define a current year (pivot between past and future)
- Display up to 50 rows of data
- Filter metrics by units and segments
- Show legends in values or percentages
👉 Decision impact: Supports data validation and consistency checks before analysis.
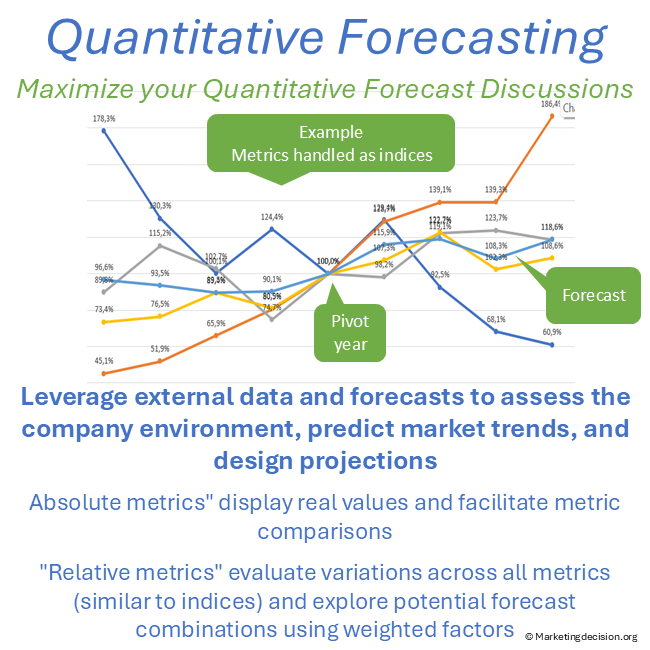
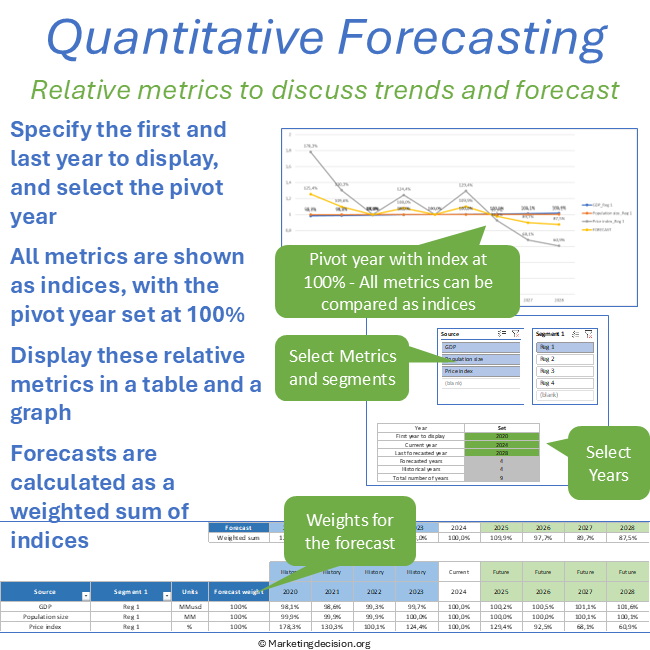
Tab “3. Relative Metrics”
Displays all metrics as indexed trends (relative to a pivot year).
Key advantages:
- Enables cross-metric comparison
- Highlights growth patterns
- Supports weighted forecasting
Features:
- Same filtering and display logic as Absolute tab
- Metrics expressed as percentage evolution
- Full flexibility on segment selection
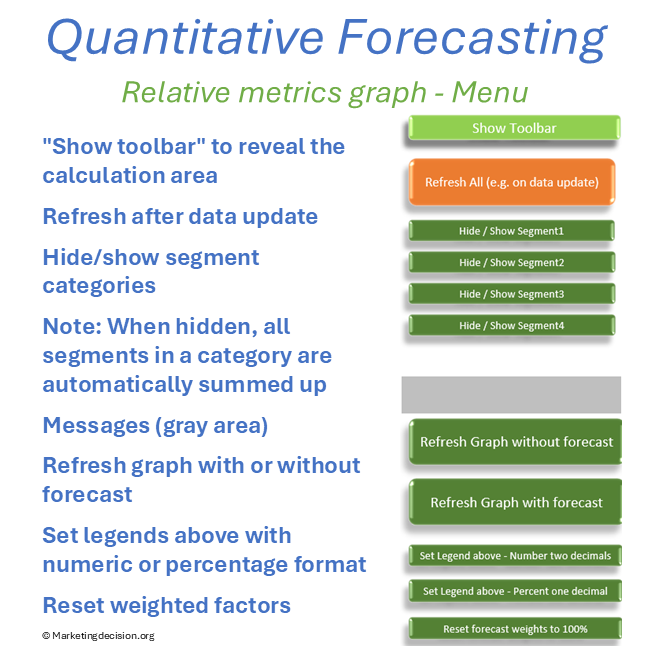
Forecasting Feature (Relative Mode)
This is the core of the tool.
- Combine multiple metrics into a single forecast
- Apply weighting factors to each metric
- Automatically normalize weights to 100%
- Display forecast with or without individual metrics
👉 Decision impact: Enables you to build a defendable and transparent market growth assumption.
Links and References
Forecasting is more reliable when market drivers are clearly defined.
👉 Visit Market Mix to understand the structural foundations behind forecasts.
Usage & Licensing
This product is intended for professional use only. Please review the Sales Conditions to fully understand your rights and usage limitations.
Licensed for a single business unit (up to 100 employees)
Additional licenses required beyond this scope
Download link valid for 2 months
Up to 10 downloads allowed
Users have full access to the application, including embedded macros, and may adapt it to their needs. However, all branding, trademarks, and references must remain visible and unchanged.
Ensure that you have Microsoft Excel and a PC running Windows before purchasing this application. This application uses advanced dynamic range calculations introduced by Microsoft. Please ensure that you are using a compatible version of Excel, such as Microsoft 365, or any version released after Excel 2019 which supports this feature.
We appreciate your feedback on how to improve this application. Feel free to share your suggestions with us at contact@marketingdecision.org
In Summary
This market forecasting Excel tool provides a structured and flexible way to combine multiple data sources into a single forecast.
By enabling multi-metric comparison, weighted analysis, and scenario development, it supports more robust, transparent, and actionable market insights, helping teams make better-informed strategic decisions with confidence.