
Assess market events, compare their probability and potential impact, and bring different perspectives together to strengthen your market forecast.
The Qualitative Forecasting – Market Event Assessment Tool helps teams identify, evaluate and structure potential future events that may influence the market.
Use available data, expert judgment, market observations and weak signals to assess events according to their probability and potential impact. Compare different perspectives, focus discussion on what matters and bring important developments into your market forecast.
Designed for professional use, the application is provided as an Excel file and is available in English.
€33.00 Exc. VAT
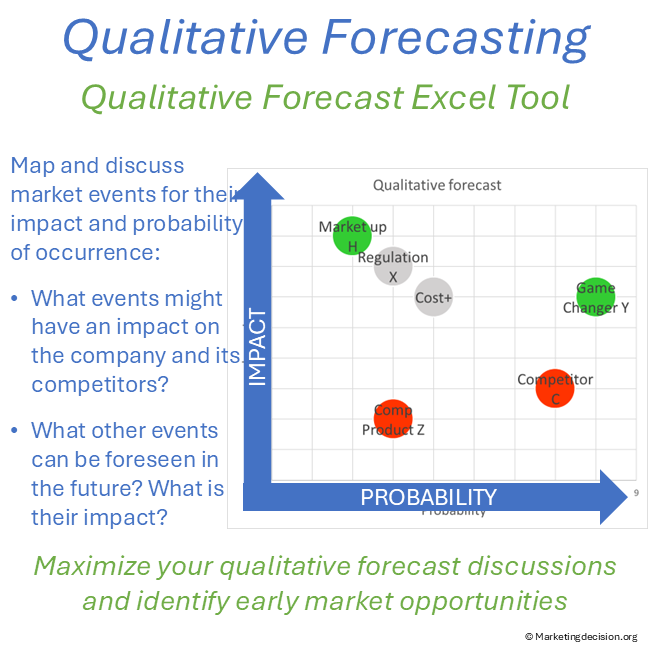
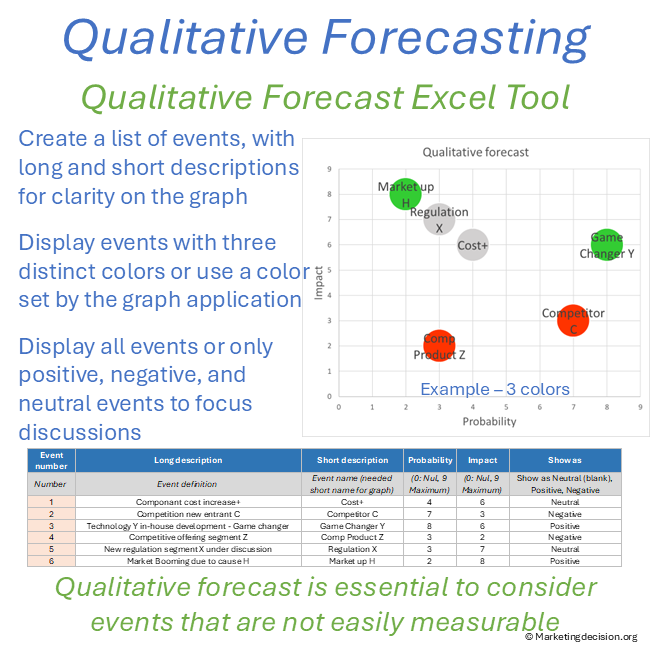
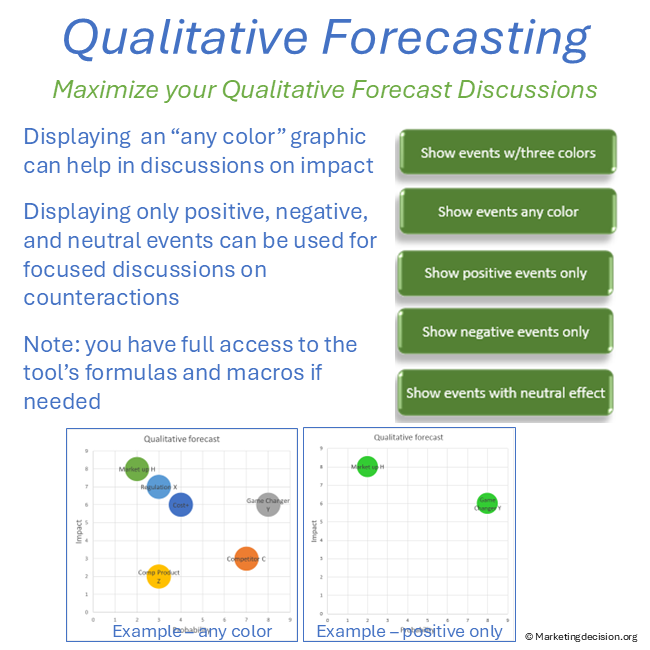
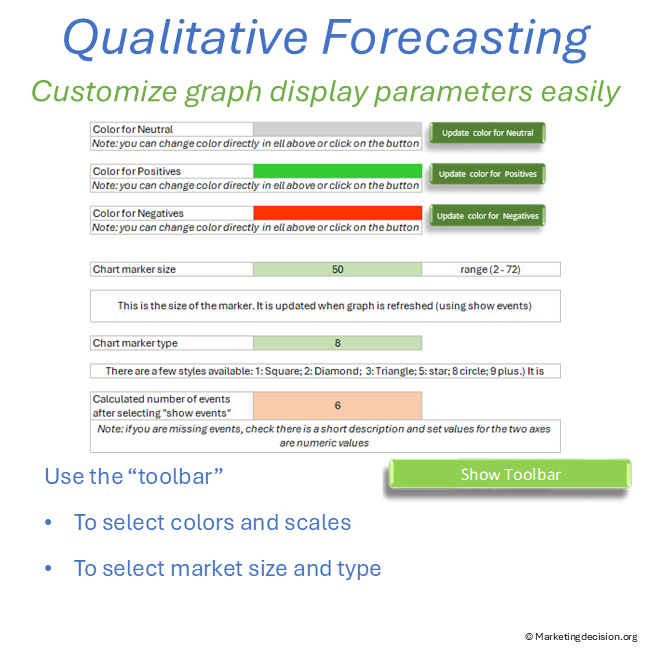
Qualitative forecasting is essential when market developments are uncertain or their potential effects are not yet quantifiable.
Many developments that may influence a market cannot yet be quantified or their effects estimated reliably. Changes in technology, regulation, competition or customer behaviour may affect future market development before their consequences appear in historical data.
Typical situations include:
Quantitative forecasting remains essential where measurable evidence is available. Qualitative forecasting helps bring these uncertain developments into the forecast rather than excluding them because they cannot yet be quantified.
It helps teams identify potential market events, assess their probability and impact, compare different perspectives and determine which developments deserve further attention.
To understand how quantitative forecasting, qualitative forecasting and Scenario Planning work together, see the Market Forecast methodology.
The Market Event Assessment Tool helps teams turn observations and uncertain developments into a structured market assessment.
Each event is assessed using two simple dimensions:
Events are then automatically positioned on a visual matrix.
The assessment is first a matter of judgment. Different people may assess the same event differently, making comparison and discussion particularly valuable.
Within a defined forecasting horizon, probability allows teams to assess how likely an event is without having to predict exactly when it will occur. Events can therefore be compared according to their relative probability and impact. Where useful, predefined criteria or scorecards can support a more structured assessment.
High-impact events should not automatically be dismissed because their probability is low. Their potential consequences may justify further monitoring, investigation or exploration through Scenario Planning.
The objective is not to create artificial precision. It is to make assumptions explicit, comparable and discussable.
This structured visualization helps teams:
These dimensions should be assessed within a structured market perspective. See our Market Mix framework for the broader context guiding these evaluations.
A market forecast is rarely built by one person using one source of information.
Marketing, sales, finance, product teams, regional organizations and management may observe different signals and interpret the same developments differently.
The Market Event Assessment Tool provides a common framework for bringing these perspectives together. During a market review, team workshop or strategy session, it can help teams:
Differences in judgment are valuable information. They can reveal assumptions, uncertainties or perspectives that would otherwise remain hidden.
The tool does not make the decision for the team. The real value lies in structuring conversations and anchoring insights into a shared visual framework.
The tool provides a structured environment for recording, assessing and visualizing market events.
These capabilities help transform a long list of observations into a structured and comparable view of future market developments.
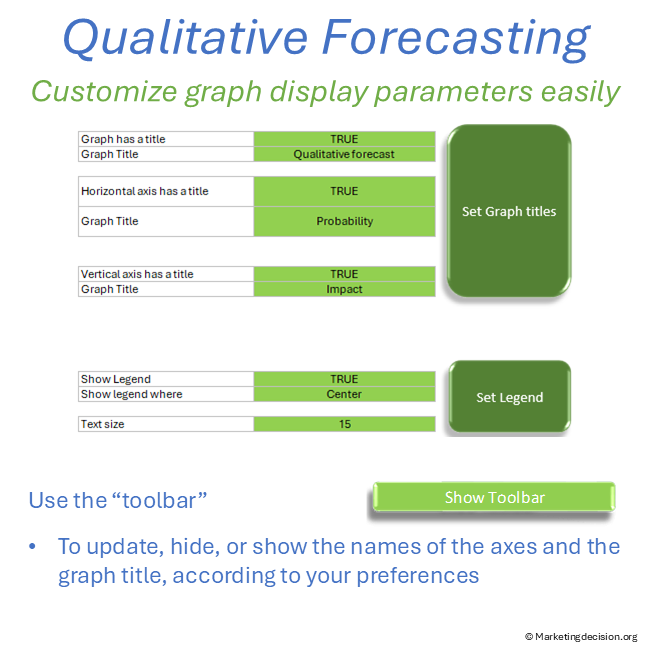
The tool includes customization options to adapt the visualization to different analyses and presentations:
Users also have full access to the embedded macros, allowing further customization when required.
Market events do not appear from nowhere.
They can emerge from 360° horizon scanning, PESTLE analysis, Porter’s Five Forces, competitor analysis, customer and market research, market trend analysis, economic indicators, technological developments, regulatory monitoring, or insights from sales teams and regional organizations.
Bringing these different sources together helps teams develop a broader view of developments that could influence the market.
The tool acts as a consolidation layer, bringing dispersed market insights, available data and different perspectives into a structured and actionable view.
First understand what is happening in the market. Then assess what those developments could mean for the future.
The Market Mix provides the broader framework for understanding the market environment, while Market Visibility and Competitive Advantage explores how organizations can build and maintain this broader market view.
Important and uncertain developments can then provide input to Scenario Planning, where alternative combinations of events and assumptions can be explored.
This creates a natural bridge between market analysis, qualitative forecasting, Scenario Planning and marketing decision-making.
Quantitative and qualitative forecasting provide complementary perspectives on future market development.
Quantitative Forecasting helps teams compare measurable market information and develop quantitative market assumptions.
Qualitative Forecasting helps assess events and developments that are difficult to quantify reliably. It can challenge assumptions and provide important input for reviewing and, when appropriate, revising the quantitative forecast.
Using both approaches helps teams combine measurable evidence with developments that historical data may not yet capture.
To learn more about the Quantitative Forecasting Tool, click the button below.
The tool can be used individually, but much of its value comes from bringing different market perspectives together. A structured workshop helps teams identify important developments, compare judgments and translate the discussion into stronger market forecasts and decisions.
Start by reviewing the objective of the workshop and the forecasting horizon. Participants should understand what market or business question they are considering before discussing individual events.
Start by asking participants to identify developments that could influence the market. A Post-it session can work particularly well.
At this stage, do not try to classify events or assess their probability and impact. The purpose is to capture observations, weak signals, concerns and ideas freely and allow the team to develop a broad view of what might matter.
Let the discussion develop, but facilitate it so that the group does not begin the assessment too early.
Review the events together and discuss what they represent. Similar or closely related events can be grouped.
The objective is not necessarily to create an exhaustive list for every discussion. A focused set of around a dozen significant events is often a good starting point for a workshop, although more events can be assessed when useful.
The tool can maintain a broader list of market events and filter those selected for a particular review, allowing teams to focus the discussion without losing the wider market perspective.
Keep the purpose of the exercise visible. Give particular attention to developments that could require a change in strategy, different investment, additional market research or specific action.
Position the selected events according to their probability of occurrence and potential impact.
Before starting, make sure participants share an understanding of the scales and the time horizon being considered. The assessment is primarily comparative: how does one event compare with another?
Discussion is an important part of the process. For this reason, relatively small groups work well. A group of around five people allows different perspectives to be expressed while keeping the discussion manageable.
With a larger workshop – for example, 10 or 12 participants – consider creating two groups. Each group can complete its assessment independently before presenting and comparing its findings.
Review the completed assessment together.
Where does the team agree? Where do assessments differ? Why do they differ? Different judgments may reveal assumptions, information gaps or perspectives that deserve further investigation.
The objective is not to create an artificially precise prediction. The value lies in understanding the relative importance of events through the combined consideration of probability and impact.
Discuss the implications:
The findings can then be consolidated and discussed with senior management as part of the broader forecasting and decision-making process.
Selected events can then be monitored and reassessed as new information becomes available. Their probability, potential impact and implications may evolve over time.
Market forecasting is not an isolated exercise.
The information developed through market analysis and forecasting contributes to broader marketing and business planning. Understanding possible future developments can influence choices concerning markets, customers, solutions, channels, resources and priorities.
The Market Event Assessment Tool therefore forms one part of a broader decision process.
It can help teams move from: Market observations > Structured assessment > Stronger forecasts > Scenarios > Decisions
For the broader framework connecting market assessment with marketing planning, see Marketing Decision Making.
Purchase and use of the application are subject to the applicable General Sales Conditions.
General Sales Conditions — English
Conditions Générales de Vente — Français

We use cookies to improve your experience on our site. By using our site, you consent to cookies.
Manage your cookie preferences below:
Essential cookies enable basic functions and are necessary for the proper function of the website.
These cookies are needed for adding comments on this website.
Stripe is a payment processing platform that enables businesses to accept online payments securely and efficiently.
Service URL: stripe.com (opens in a new window)
Statistics cookies collect information anonymously. This information helps us understand how visitors use our website.
Google Analytics is a powerful tool that tracks and analyzes website traffic for informed marketing decisions.
Service URL: policies.google.com (opens in a new window)