Description
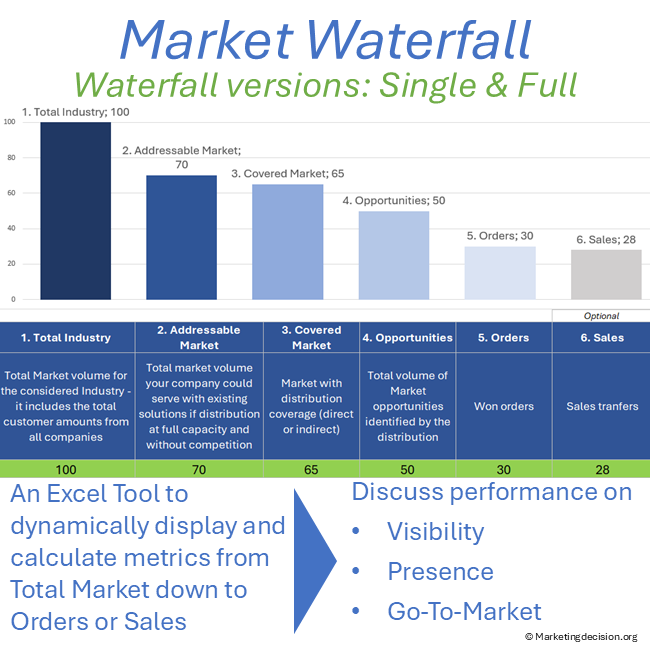
The Market Waterfall Tool provides a detailed and intricate view of volumes, from the overall market down to final orders (or sales). It serves as a platform for an in-depth review of current performance and areas needing improvement. Through this, corrective actions can be identified to enhance market penetration.
Engaging in discussions with Sales and Marketing teams is key to thoroughly assessing the company’s Go-To-Market performance. Specifically, crucial topics such as market visibility, market share, and market intelligence can be best addressed with the Market Waterfall Tool.
It provides the capability to focus discussions among Marketing, Sales (both direct and indirect), and other involved departments on market visibility, positioning, and performance.
Interestingly, even when only partial data is available, valuable discussions can still take place with partners, direct sales, or indirect sales via distributors. These discussions may cover visibility (“How much of the market is seen or addressed?”), presence (“How many of those prospects are engaged?”), and performance (“How many of the deals are won or lost?”).
Key Features of the Market Waterfall Tool
Dynamic Excel Slicers for Market Data
- Analyze the market with dynamic Excel slicers for dates and segments.
- Filter data dynamically to focus on specific market segments or time periods.
Market Waterfall Analysis
- Map volumes from total market to orders and sales with a market waterfall analysis.
- Visualize go-to-market visibility and coverage with customizable graphs.
Go-to-Market Visibility and Coverage
- Compare market share and performance across segments.
- Use the tool to guide investment decisions and strategic planning.
Multiple Versions for Flexibility
- Single Waterfall Version: Filter data along a single axis for segmentation.
- Waterfall by Segment Version: Analyze data across multiple market segments and time periods.
How to Use the Tool
- Enter Your Data: Use the dedicated data entry tab to input market and company data.
- Select Segments and Dates: Use Excel slicers to filter data by segments and time periods.
- Analyze Market Waterfall: Review the calculated market waterfall for each segment.
- Visualize Results: Use the graphs to visualize market visibility, coverage, and performance.
Use Cases
Market Waterfall Analysis
- Analyze market waterfall trends to identify growth opportunities and risks.
- Use the tool to guide go-to-market performance discussions.
Go-to-Market Performance Discussion
- Compare market share across different segments to identify strengths and weaknesses.
- Use the tool to guide investment decisions and strategic planning.
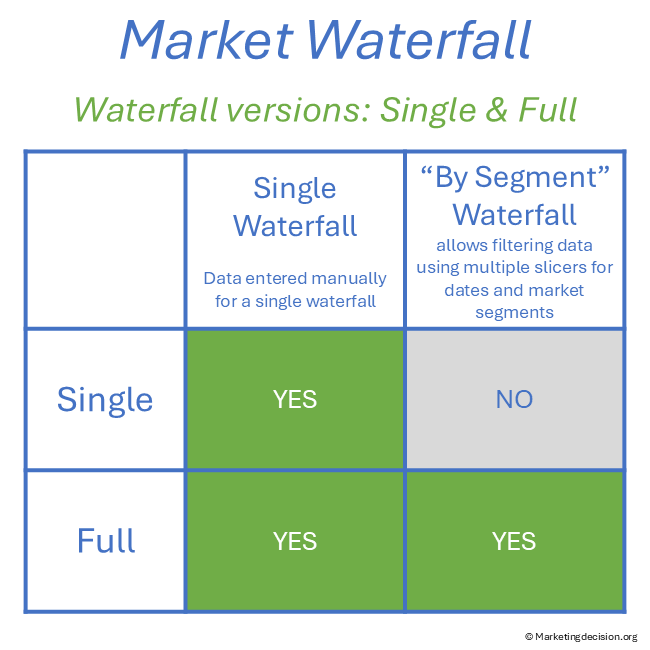
The Proposed Excel Tool Exists in Two Versions
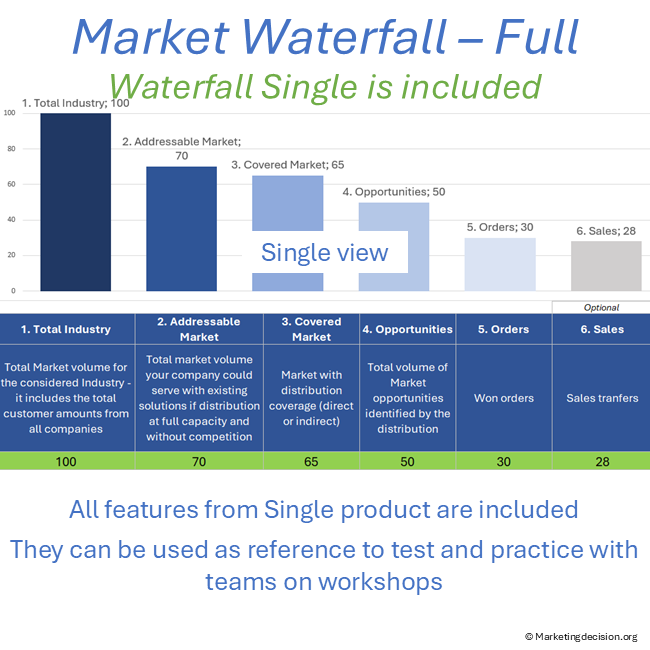
The Single version provides capability to display a Single Waterfall with graphs and metrics.
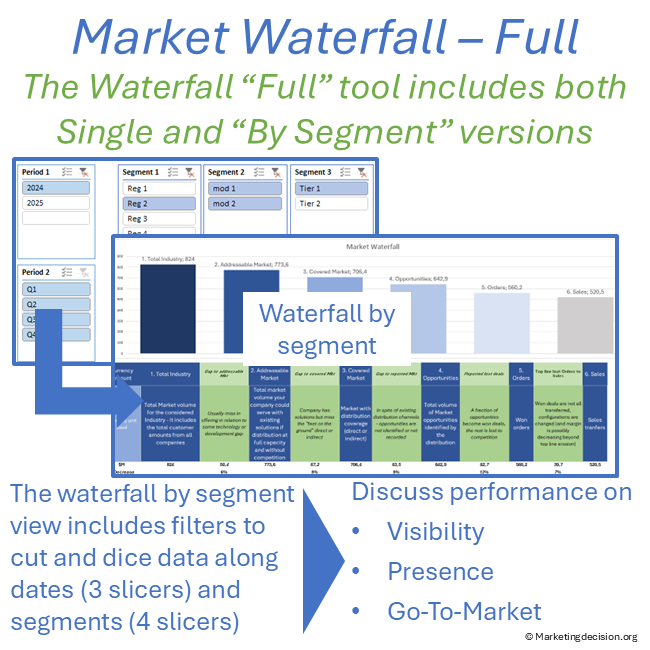
The Full version includes two versions of the waterfall, each of which can be used independently:
- Single Waterfall: Same as the version for the Single version.
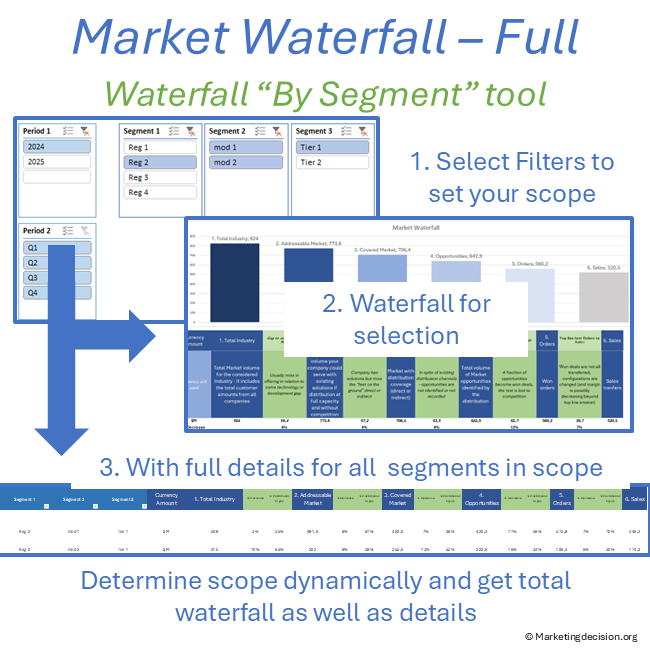
- Waterfall by Segment: Allows the display of a waterfall filtered across multiple market segments and time periods.
Single Waterfall
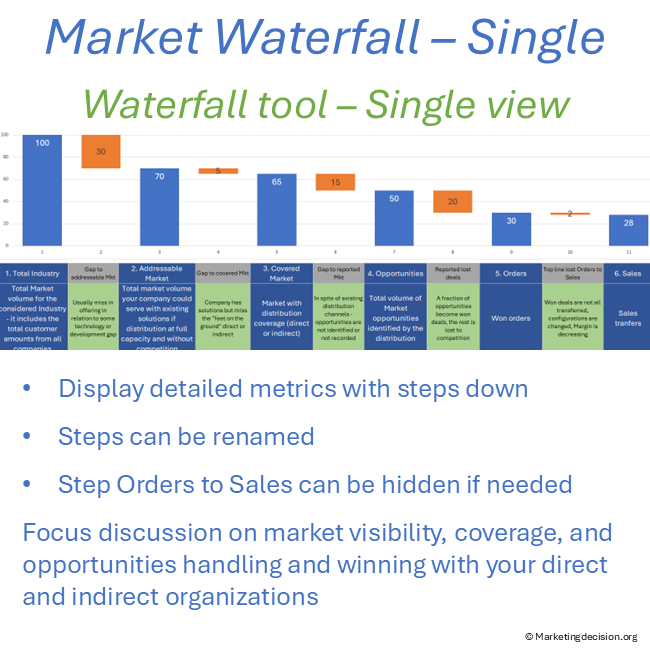
The Single Waterfall is typically used when analyzing a single market segment, from market to actual orders or sales. Data can be entered directly in this tab, with results updated instantaneously.
Waterfall by Segment
The Waterfall by Segment enables filtering by multiple market segments and time periods using slicers. It is particularly useful for summarizing findings across different segments and making meaningful comparisons. This approach helps establish long-term mechanisms to ensure sales teams remain focused on visibility, coverage, and performance.
The Waterfall by Segment version is populated via a dedicated data tab where you can enter market-to-order or sales data for as many segments and time periods as needed.
Single Waterfall and Waterfall “By Segment” Common Features
Each version of the Waterfall allows the display of the following steps:
- Total Industry
- Addressable Market
- Covered Market
- Opportunities
- Orders
- Sales
Hiding or Displaying the Last Step
The final step, “6. Sales,” is sometimes considered optional, as sales outcomes may not be solely the result of sales and marketing efforts. Specifically, the “Orders to Sales” conversion can be impacted by multiple factors, requiring different types of focused meetings. This step may also represent margin erosion rather than top-line revenue erosion. If necessary, this column can be hidden in the Excel tool.
Renaming Waterfall Steps
For flow products, it may be useful to merge orders and sales. The tool allows renaming any of the waterfall steps as needed.
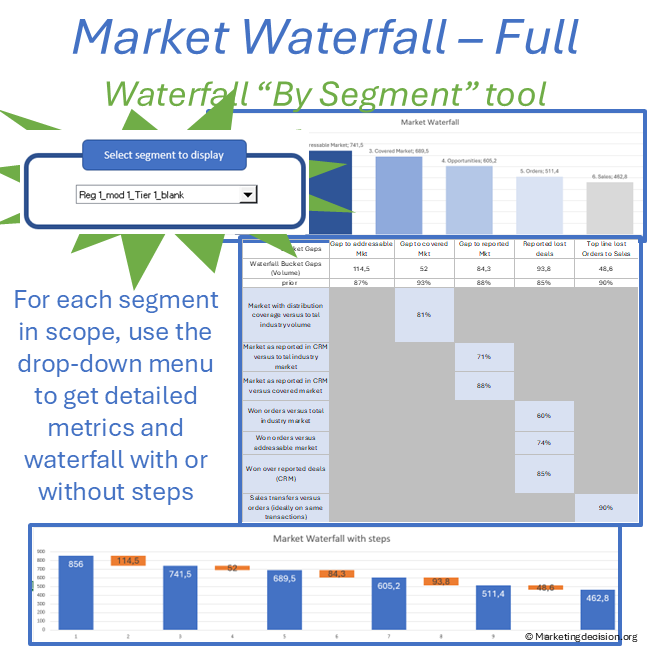
Graph with Steps
An additional waterfall graph is included in the same tab (to the right), displaying step-down calculations visually. This helps facilitate in-depth discussions and precise gap analysis.
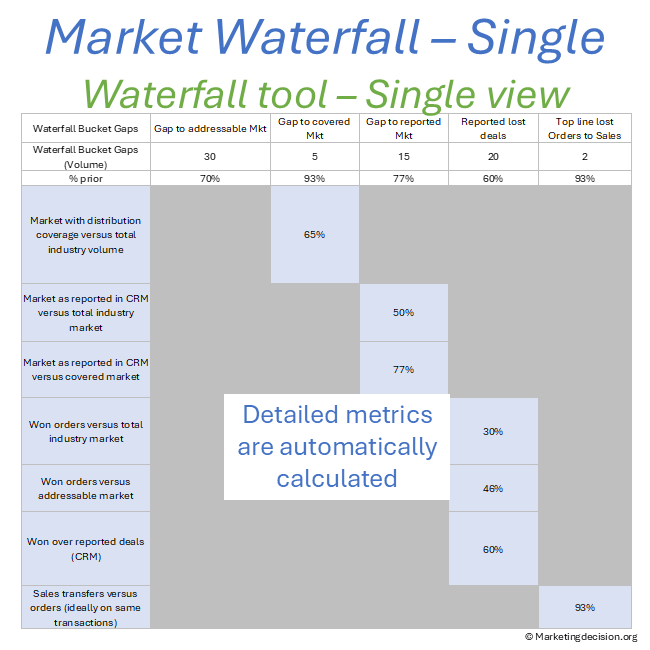
Multiple Metrics
Several key metrics are automatically calculated and displayed below the waterfall, with definitions provided. These include:
- % Coverage
- % Visibility (over industry market)
- % Visibility (over covered market)
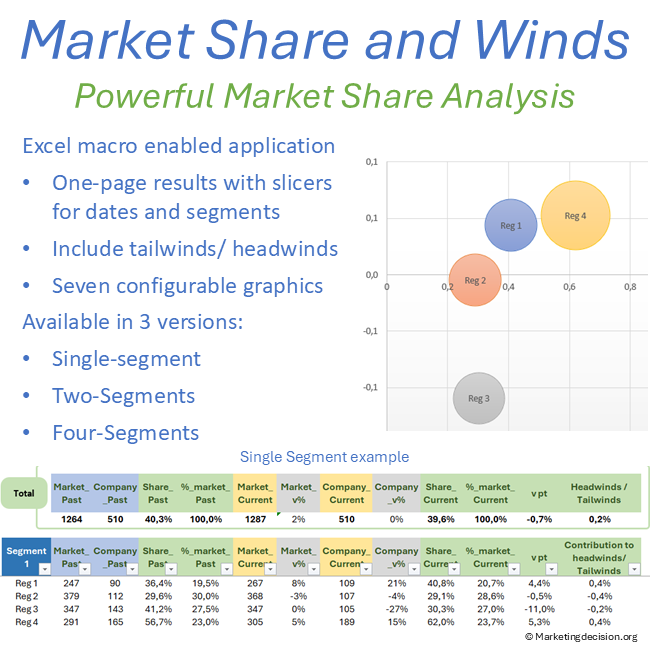
- Market Share (over industry market)
- Market Share (over covered market)
- Win/Loss Ratio
- Converted Top Line
Data Entry – Single Waterfall Version
Metrics are entered in a single location below the graph. Results are automatically calculated (or press F9 if the tool is set for manual calculation).
Waterfall “by Segment” – Features Available Only in the Full Version
Data Entry – Waterfall by Segment Version
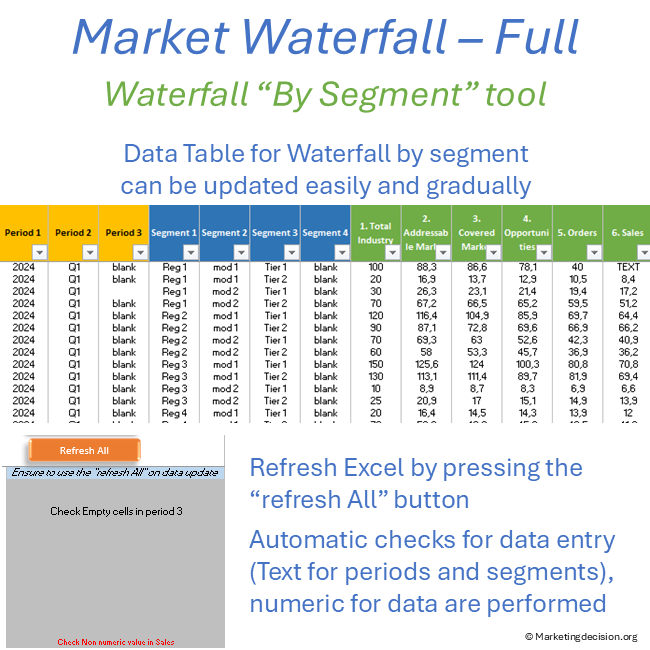
- The Waterfall by Segment is populated exclusively via the dedicated tab “2.1. Data by Segment.”
- This tab allows for multiple criteria, including time periods and market segments. To maximize usability, data should be entered at the highest level of granularity.
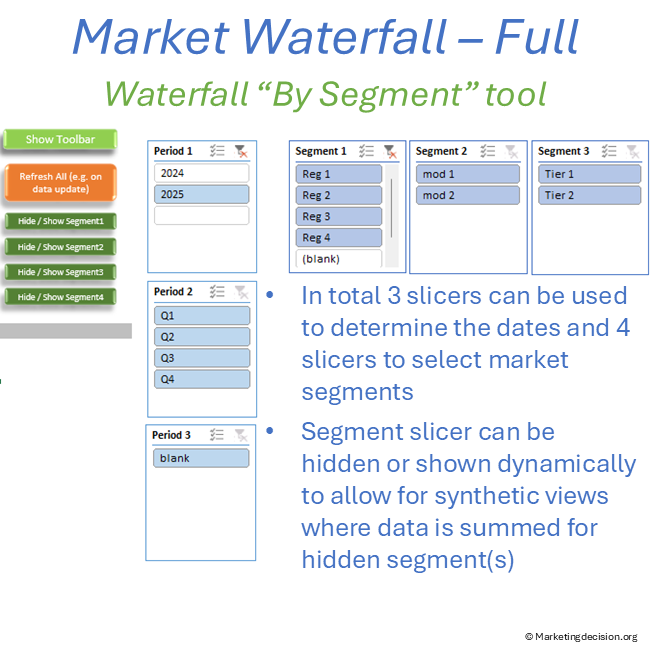
- 3 slicers are allocated to time periods data, and 4 slicers are allocated to market segments.
Data Verification
Multiple checks ensure that numeric data is entered correctly. Any detected issue is reported in the range S3:S11. Notably, all filters (periods or segments) must be populated with text, as shown in the example.
Pre-Populated Example Data
The tool is pre-filled with example data, where filters are set as follows:
- Slicer 1: Period 1 = Year
- Slicer 2: Period 2 = Quarter
- Slicer 3: Period 3 = Undefined (can be used for monthly data)
- Slicer 4: Segment 1 = Regions (in this example)
- Slicer 5: Segment 2 = Modalities or P&L
- Slicer 6: Segment 3 = Market Tiers
- Slicer 7: Segment 4 = Undefined (can be used for a sub-region view)
You can customize the time periods and segments to match your organization’s structure and available data.
Note: Before replacing the example data with your own, ensure you keep a backup of the original file.
Market Segment “Slicers”
The data is consolidated via a pivot table, where each slicer represents a market segment or time period selection. As a result, the Market Waterfall displays the total contribution across selected dates and market segments.
A key feature of this tool is the ability to view individual segment contributions to the total.
This is done by selecting a segment from the “Select Segment to Display” drop-down list. This powerful function allows for detailed visibility into how different segments contribute to the overall waterfall.
Hide/Unhide Segments “Slicers”
If you need to aggregate all data under a segment (e.g., when details are not required), use the “Hide/Unhide Segment” button. For example, in the provided dataset, you can sum all Modalities (P&L) for Segments 2 and 3, then hide those details and continue working with Segment 1 (Regions). This feature allows for both detailed and high-level views.
After updating data in tab “2.1. Data by Segment”, press “Refresh All” to update calculations.
You can use slicers (holding CTRL while clicking) to select multiple periods or segments simultaneously.
Advanced Menu
The “Show Toolbar” menu grants access to a normally hidden calculation area.
- For the Single Waterfall version: This space contains comments and can be customized for additional calculations or notes.
- For the Waterfall by Segment version: This space includes multiple calculation areas. Do not delete or overwrite any cells in orange, as these are used for calculations, including dynamic tables.
Links and References
Waterfall reviews gain meaning when connected to market structure. Refer to Market Mix to anchor waterfall interpretation.
Market visibility and coverage metrics are only actionable when tied to how solutions are designed, priced, and sold. For this broader perspective, see our Solution Mix chapter.
Coverage and visibility metrics gain meaning when tied to Go-to-Market design. Visit Place Mix Strategy for the broader view.
Usage & Licensing
Please review the Sales Conditions published on this website to fully understand your rights and the restrictions regarding the use of this product. Our products are intended for professional use only and are not designed for consumer purposes.
The products provided under this agreement are exclusively for the individual buyer or members of the same business unit. Sharing, distributing, or making them available to individuals or teams outside the designated user or relevant business unit is strictly prohibited. For software licensing purposes, a business unit is limited to a maximum of 100 employees, including full-time, part-time, and temporary staff. Additional licenses must be purchased in multiples of 100 if this limit is exceeded.
The provided download link is valid for two months and allows up to 10 downloads. Be sure to save a copy before the link expires or the download limit is reached. Users have full access to the application product, including any embedded macros, and may make necessary adjustments to suit their needs. However, all branding, trademarks, and references to marketingdecision.org must remain visible and intact within the application.
Ensure that you have Microsoft Excel and a PC running Windows before purchasing this application. This application uses advanced dynamic range calculations introduced by Microsoft. Please ensure that you are using a compatible version of Excel, such as Microsoft 365, or any version released after Excel 2019 which supports this feature.
We appreciate your feedback on how to improve this application. Feel free to share your suggestions with us at contact@marketingdecision.org

