Description
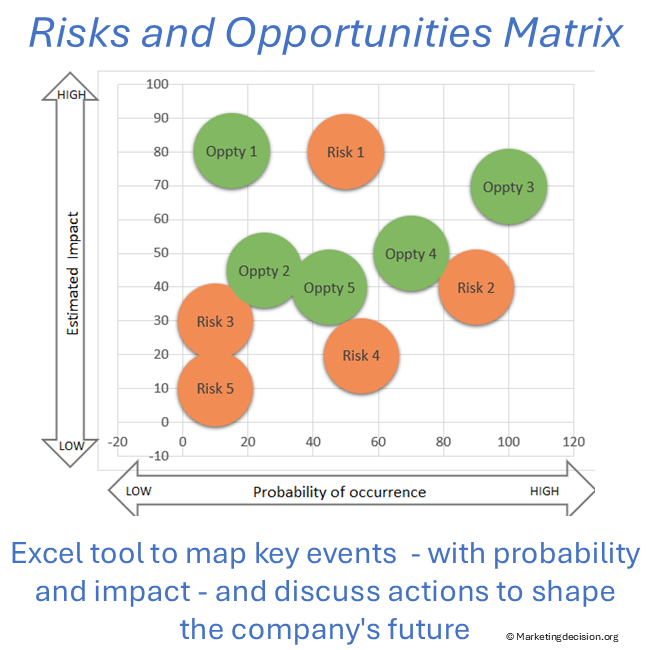
A significant step in understanding the market environment involves calibrating risks and opportunities. Opportunities represent potential future gains that your company and your competitors will consider and pursue. Risks, on the other hand, have the potential to harm existing capabilities and the overall market.
The Risks-and-Opportunities Matrix tool considers both aspects using the same axes for analysis: probability of occurrence and impact. It can sometimes be challenging to categorize an event as either a risk or an opportunity. One event may be perceived as positive for some while being viewed as negative or a threat by another. This is why the consideration of positive or negative impact, whether it is a risk or opportunity, should be kept for the next step, after all risks and opportunities have been identified, and when possible actions are discussed.
Features
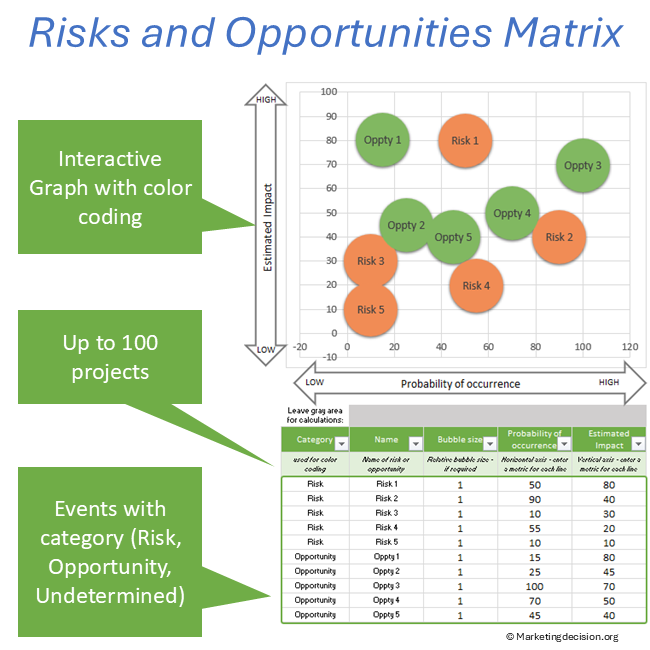
This Excel tool allows you to display a list of risks and opportunities events that you have identified. They can be showcased on a bi-dimensional matrix with two axes defined as Impact and Probability of occurrence. Bubbles can be displayed with different relative sizes if some risks and opportunities need to be highlighted, or to differentiate between them using another criterion (such as $ impact).
Categories can be assigned to each event so they can be displayed in different colors. This feature enables the highlighting of events based on whether they are considered positive, negative, or undetermined, or to differentiate based on market segment.
To consider another set of dimensions, it is possible to modify the axis descriptions by selecting the advanced menu.
To create a list of risks and opportunities, you can follow these steps (note that this process can be repeated multiple times with different teams):
- Identify risks and opportunities by gathering teams from various functions besides Marketing.
- Categorize them initially based on their estimated impact and probability – decide on the scale you’d like to use so that all can be appropriately compared on the same graph.
- Determine suitable categories for these events: Positive, Negative, or Undetermined.
- Discuss and review the identified Risks and Opportunities.
The Marketing Risks and Opportunities Matrix serves as a valuable tool for summarizing these findings. It assists in prioritizing which events should be reviewed first to gain a deeper understanding of their implications and the actions to be taken. This tool acts as an interface between two critical marketing stages: one where a comprehensive market analysis is completed, and the other where short and long-term actions are determined and integrated into marketing and business plans.
Advanced features
Select the green button “show toolbar” to display the advanced features on the left in the “toolbar” (click again to hide the toolbar):
Data selection:
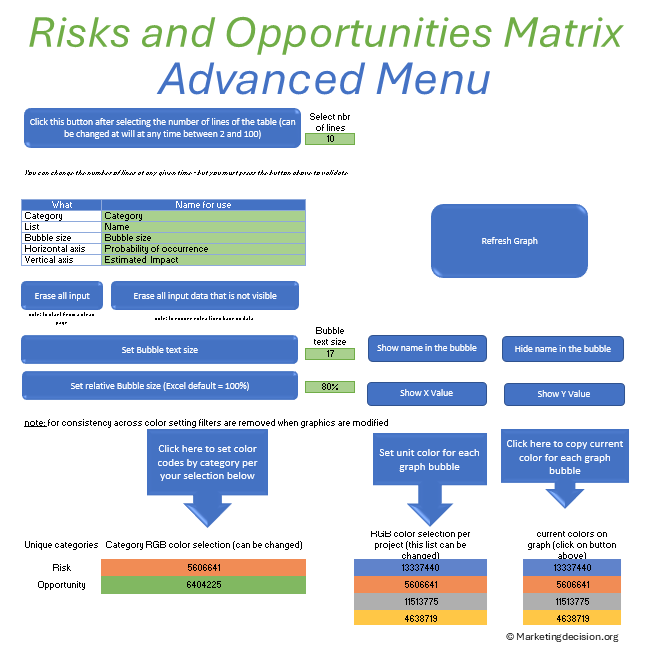
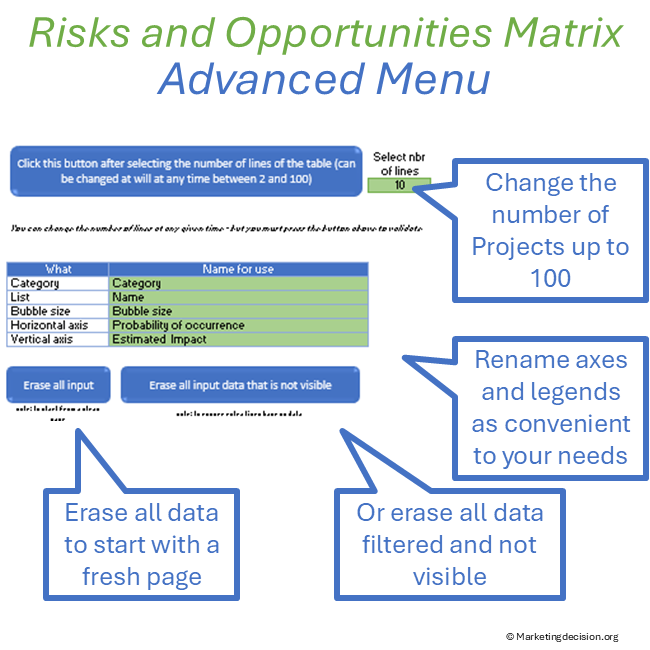
- Select the number of lines for the table between 2 and 100.
- Erase all input data: This button erases all data in the table.
- Erase all input data that is not visible: Click this button to erase data from the table that is not visible. This can take a few tens of seconds.
- Names for axes and table legends can be updated.
- Filter the category column to display only selected projects.
Legends capabilities:
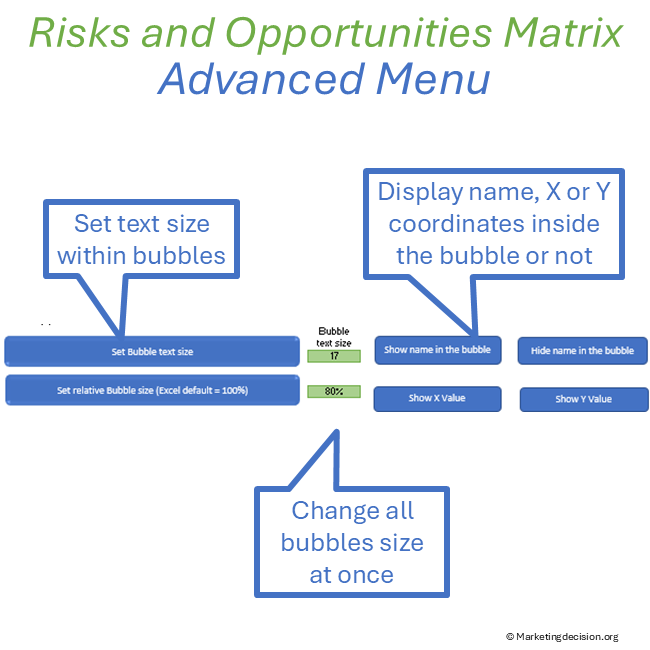
- Show Names on the graph bubbles.
- Hide names on the graph.
- Set bubble text size: Click this button once the bubble text size value is updated.
- Set relative bubble size (Excel default = 100%): Click this button once the relative bubble size is updated.
- Show horizontal axis value on the graph bubbles.
- Show vertical axis value on the graph bubbles.
Changing color schemes:
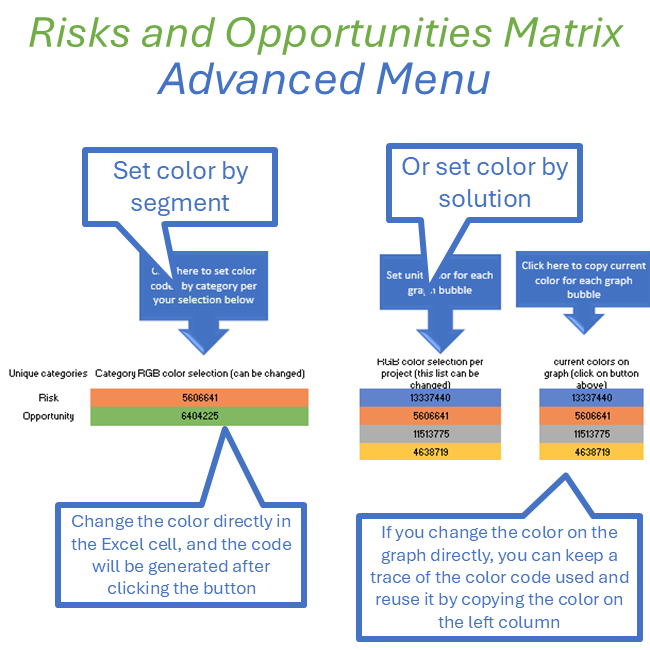
Setting color for bubbles as a function of category:
For different colors just modify the color assigned to the category. The value inside the cell represents the color code and is generated automatically. It is here for reference.
Setting color for each graph bubble:
For each graph bubble a different color can be selected. You can set a color for each line. The value inside the cell represents the color code and is generated automatically. It is here for reference.
Copying current bubble color code:
Use this function if the color was changed directly in the graph. It will save the color in the table below. Use this if you want to keep the colors selected directly on the graph, by copying these colors in the column below “Set unit color for each graph bubble.”
Note: you have full access to the macros of this file, so you can adapt or create new macros. Please share the needs you’d like to see addressed in a future version.
Usage & Licensing:
Please review the Sales Conditions published on this website to fully understand your rights and the restrictions regarding the use of this product. Our products are intended for professional use only and are not designed for consumer purposes.
The products provided under this agreement are exclusively for the individual buyer or members of the same business unit. Sharing, distributing, or making them available to individuals or teams outside the designated user or relevant business unit is strictly prohibited. For software licensing purposes, a business unit is limited to a maximum of 100 employees, including full-time, part-time, and temporary staff. Additional licenses must be purchased in multiples of 100 if this limit is exceeded.
The provided download link is valid for two months and allows up to 10 downloads. Be sure to save a copy before the link expires or the download limit is reached. Users have full access to the application product, including any embedded macros, and may make necessary adjustments to suit their needs. However, all branding, trademarks, and references to marketingdecision.org must remain visible and intact within the application.
Ensure that you have Microsoft Excel and a PC running Windows before purchasing this application. This application uses advanced dynamic range calculations introduced by Microsoft. Please ensure that you are using a compatible version of Excel, such as Microsoft 365, or any version released after Excel 2019 which supports this feature.
We appreciate your feedback on how to improve this application. Feel free to share your suggestions with us at contact@marketingdecision.org